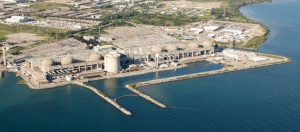
OPG on their way to Record Profits for 2020

Having missed OPG’s press release on their 2nd Quarter financial results a few days ago, a post on Scott Luft’s twitter account stating: “OPG released Q2 results. Net income during the first half of 2020 is $775 million – which is greater than their full year net income in all but one year from 1999-2015” alerted me!

What the above suggests is OPG will finish the year with record profits despite most of Ontario’s industrial companies being negatively affected by the Covid-19 lock-down. It seems ironic one of the province’s wholly owned companies will achieve record results with the economy brutalized and electricity consumption falling.  For the first six months of 2019 Class A and B consumption was 68.7 TWh and for 2020 it fell to 65.5 TWh for a drop of 3.2 TWh or 4,7%.

OPG’s revenue in the first six months was up from $2,992 million in 2019 to $3,569 million or $577 million (+19.3%). In 2019 OPG generated 39.3 TWh versus 41.6 TWh in 2020. OPG provided 63.5% of all ratepayer consumption in 2020 versus 57.2% in 2019. It seems incongruous the increased generation of 2.3 TWh produced additional revenue of $548 million (net of fuel expenses).

On closer examination of the foregoing the commentary in the report states OPG spilled 1.9 TWh of hydro in 2019 whereas in 2020 it was 2.5 TWh due to SBG (surplus baseload generation) so that would have added some revenue.  The additional spilled hydro payments however would only account for about $30 million of the $548 million increase so why did gross revenue climb by so much?

As it turns out most of the huge jump in revenue came about because of a rate approval from the OEB in 2018 related to OPG’s nuclear plants. The OEB had, for some reason, been sitting on the rate application for a considerable period.  While OPG generated an additional 1.6 TWh from nuclear plants it accounted for about $150 million in additional revenue.  The rate increase for the balance of the nuclear generation added approximately $260 million and the rest of the increase in revenue came from gas generation facilities (some recently acquired by OPG) and the balance from their US hydroelectric owned facilities purchased in October 2019.

The average cost per MWh of nuclear power generated by OPG in the first six months of 2019 was 81.80/MWh and jumped to 94.20/MWh in 2020 for an increase of 15.1%.

The upsetting part about the results is OPG has, so far in 2020, produced a ROE (return on equity) of 9.2% during the pandemic lock-down on the $775 million of after tax* ($199 million) net profit! Most private sector businesses are losing money meaning their return on equity is negative and has/will result in many of them declaring bankruptcy or being forced to lay off employees.  Those they lay off will continue to have to pay their electricity bills which are among the highest in Canada and the US.

OPG’s favourable ROE does nothing to alleviate the expensive electricity bills which businesses (small and medium) and residential ratepayers must pay.  The Provincial government should use the $199 million of tax revenue from OPG to reduce ratepayer costs and instruct the OEB to consider lowering the allowed ROE to prevent further increases on our extremely high electricity bills.

The Provincial Government should also move to subvert those high cost wind and solar contracts handed out by the McGuinty/Wynne government that are a continuing burden on all ratepayers.

*While OPG allocates tax costs they are actually referenced as PIL (payments in lieu) of actual taxes and are simply recorded as revenue within the Provincial budget.

Ontario is a Bottomless Pit for Class B Ratepayers as the ICI Demonstrates

The Ford Government announced, via a press release, on June 26, 2020 that they were freezing the rates for Class A ratepayers for two years.  That means they will not be required to reduce consumption during peak hours! In Ontario those “peak hours” generally occur during the hot summer months.  Greg Rickford, Minister of Energy, Northern Development and Mines stated: “Today’s announcement will allow large industrial employers to focus on getting their operations up and running and employees back to work, instead of adjusting operations in response to peak electricity demand hours.”

The purpose of the freeze had to do with the fact that Ontario’s electricity consumption had fallen due to the pandemic; meaning our surplus capacity was exacerbated driving down the HOEP (market price), causing hydro spillage, wind curtailment, nuclear steam-off and increasing exports of surplus electricity.  All of the foregoing adds to the bill Class B ratepayers and taxpayers would be required to pay for, due to the reprehensible design of the Industrial Conservation Initiative (ICI) by the former government and the GEA which brought us intermittent and unreliable wind and solar generation backed-up with gas plants.

Despite the obvious benefit of the freeze at this time for both Class A and Class B ratepayers it proved upsetting to Mark Winfield, a Professor of Environmental Studies at York University.  York is the bastion of many eco-warriors, intent on destroying the economy in their push to rid us of any use of fossil fuels.  Winfield holds a Doctorate in Philosophy which he presumably believes qualifies him as a scientist capable of opining on “climate change” and any events emanating from the Energy Ministry!  It is worth noting Merriam Webster’s first definition of philosophy is: “All learning exclusive of technical precepts and practical arts” yet Winfield, for some reason, thinks his doctorate includes those “technical precepts”!

Winfield’s article is labelled “Is Canada’s Ontario an “Innovation Wasteland” for Energy? ” and suggests among other claims; the ICI introduction and “peak demand” reduction resulted in the creation of “the leading edge of innovation in electricity systems around the world”.  While it would be relatively easy to debunk the foregoing and other claims in Winfield’s article the fact is; the creation of the Global Adjustment linked to the ICI program drove up Class B electricity rates in Ontario far in excess of inflation and had a negative effect on both residential households and small/medium sized businesses.  The latter is where 60% of private sector jobs reside and a “technical precept” ignored by Winfield! It is ironic he also ignores the fact York University several years ago installed a 5 MW gas fired turbine and a few years later added another 5 MW gas fired turbine aimed at reducing their electricity consumption and its associated costs.

I will not go to the trouble of further debunking Winfield’s article but must confess I was never a fan of the ICI program.  It is far too simple in concept in that you are only required to pick five (5) “peak hours” out of the 8,760 hours in a year and even if you are close, it will result in significant savings compared to other ratepayers.  If you are one of those Class A ratepayers, simply firing up a gas generator allows you to exit the grid or reduce your demand and signal your electricity distributor you are conserving.  The result is a significant decrease in GA costs reducing their electricity bill for the 8760 hours of the following year.  The savings in costs are allocated to Class B ratepayers.

If Winfield had bothered to do some research he might have discovered the December 2018 Market Surveillance Panel’s Report issued by the OEB (Ontario Energy Board) titled: “The industrial Conservation initiative: Evaluating its Impact and Potential Alternative Approaches”.  Some of the “Innovation Wasteland” he may have discovered in the report was the following:

Information on exactly how much on-site generation or storage has been built in response to the ICI is not readily available. Nevertheless, there is some evidence that suggests such investments are being made. In 2017 and 2018, three Class A consumers made a combined 33 applications to the Ministry of Environment and Climate Change (as it then was) to build a total of 44 MW of natural gas-fired capacity. One of the express purposes for which this new on-site capacity is being built is “peak shaving”, which in turn suggests the purpose is, at least in part, to reduce Global Adjustment costs through participation in the ICI.” At that point Winfield may have understood “natural gas-fired capacity” is fossil fuel based and for decades has been used to generate electricity.

Winfield may also have come across some other “technical precepts” such as: “Ontario currently finds itself in surplus supply conditions, yet the incentive to reduce consumption under the ICI has never been stronger. Perversely, the incentive for Class A consumers to reduce peak demand—by investing in on-site generation capacity or otherwise—is strongest when there is ample supply and wholesale market electricity prices are low.”  What that infers is; the lower the HOEP price the larger the subsidy for Class A ratepayers.

The report also noted: “The Panel estimates that payments to peaking resources make up less than 20% of the costs recovered through the Global Adjustment. The remaining 80% of fixed capacity costs are for non-peaking resources, which Class A consumers use and benefit from during most hours of the year.” To clarify, the benefit for Class A consumers picking those “peak hours” has only a 20% impact in reducing capacity costs but they benefit for the full year penalizing Class B consumers for that other 80% benefit.

Another rather shocking benefit that occurred in 2017 is described in the report as follows: “During the five peak demand hours in 2017, five directly-connected Class A consumers consumed no electricity, meaning they pay no Global Adjustment during the following 12-month period.”  In 2017 the HOEP was 1.58 cents/kWh meaning those five Class A consumers paid that price for their consumption throughout 2018 whereas all Class B consumers paid 11.55 cents/kWh (HOEP of 1.58 cents/kWh + the GA of 9.97 cents/kWh = 11.55 cents/kWh) or 7.3 times more per kilowatt hour!  A clear demonstration there is something inherently wrong with the design of the ICI.

The panel report discloses some history since the advent of the ICI came into force in September 2011 when Brad Duguid was the Ontario Minister of Energy and it brings reality to how much Class B consumers have paid to subsidize Class A consumers.  “In 2011, approximately $300 million in Global Adjustment costs were shifted from Class A to Class B consumers as a result of participation in the ICI, representing approximately 3.5% of the total electricity supply costs for Class B consumers that year. In 2017, the costs shifted had increased to $1.2 billion, representing approximately 10% of the total electricity supply costs for Class B consumers. Since 2011, participation in the ICI has shifted a total of $4.91 billion in Global Adjustment costs from Class A to Class B consumers.”

What the foregoing demonstrates is the ICI is poorly designed and should be scrapped. Minister Rickford should ensure the replacement plan treats all ratepayers fairly. It might also be time to Defund the Environmental Studies Program at York University as they have trouble with actual facts related to Ontario’s electricity sector!

Rants about Ontario’s electricity system

Canada Day came and went without parades or fireworks to celebrate the 153rd year of Canada’s birth as the Covid-19 pandemic lock-down kept many of us confined to small social bubbles.  The exceptions were those who chose to defy regulations and participated in anti-racism protests, both indigenous and anti-black ones across the country.  To most it seemed a strange way to celebrate our country’s successes. At least the weather was sunny and very warm in Ontario on July 1st!

Industrial Wind Turbines on Canada Day In Ontario

As is often the custom in Ontario on hot humid summer days, most of the IWT (industrial wind turbines) took the day off so the 4,800 MW of capacity they have was virtually silent.  Had they operated at 100% of capacity they would have delivered 115,000 MWh but instead they only managed to puff out 7,440 MWh and had 400 MWh curtailed (at 11 PM) meaning they operated at a level of capacity of 6.8% including the curtailed MWh.  As the morning broke at hour 9 AM they generated 8 MWh or 0.017% of capacity.  Fortunately, we didn’t need their power as nuclear, hydro and gas easily supplied our needs throughout the day even though total market demand reached 22,641 MWh and Ontario demand peaked at 19,342 MWh or 402,000 MWh for the full day.  Our net exports were north of 45,000 MWh which earned us ratepayers only about $750,000 while costing us close to $7 million.

Hydro One’s 1st Quarter Distribution Results raises unanswered questions

Hydro One announced their 1st Quarter 2020 results on May 8, 2020 and they were pretty unexciting with adjusted earnings of .38 cents per share compared to .52 cents in the comparable 2019 quarter. Examining this further; revenue related to Hydro One’s distribution customers increased $118 million (+ 8.9%) but they reported a decline of $82 million (- 16%), net of purchased power.  The latter reputedly climbed from a cost of $807 million in 2019 to $1,007 million in 2020 or $200 million (+ 24.8%).  Now the odd thing one notes is consumption fell by 254,000 MWh* or 3.3% yet costs increased meaning the average cost per MWh shot up $29.31/MWh from $104.29/MWh to $134.60/MWh or 28.1% and well above the increase reported by IESO!  Interestingly if one looks at Note “23. Related Party Transactions” it states in one line; “Amounts related to electricity rebates” which for 2020 totaled $433 million and in 2019 was $138 million for an increase of $295 million. That suggests in just one quarter (compared to the 2019 quarter) the Ford led government raised the taxpayer support to reduce electricity prices year over year by 213.8% if Hydro One is atypical of all distribution companies.  The foregoing is scary for taxpayers and due to the inferred net revenue decline for Hydro One it possibly signals they will apply for a rate increase which will hit ratepayers.  Additionally, it also raises the question; where did the $295 million extra received for those “electricity rebates” go as it should have kept the cost of purchased power lower than Hydro One claim?

IESO’s limited transparency

On a monthly basis the IESO, responsible for managing the Ontario electricity grid, put out data disclosing Class A and Class B Global Adjustment (GA) rates along with consumption by each Class. IESO also provide what they label as a Monthly Market Summary (MMS) and in it you will find consumption, the HOEP (market price) rate for the month and the Class B, GA. They also provide other data covering exports and imports, market demand, lots of charts showing unavailable capacity, operating reserve prices, etc. etc. and even temperature data.  The big difference in the two reports is in respect to “consumption”, ie “market demand” as for some reason the MMS fails to include DX (distributor connected) generation which are the myriad of smaller solar capacity contracts (2,200 MW), wind generation contracts (600 MW), biofuel, etc. etc. IESO is responsible for settling with the LDC (local distribution companies) for the generation for each of the contracts. Those details are presumably provided by the LDC where those contracts reside.  What that tells us is; if IESO was truly transparent they would include the monthly generation created by those DX connected generators so those of us watching the system wouldn’t have to either make assumptions or wait until IESO publish their Year-End Data.

Wind is wimpy during peak demand hours

So far in 2020 five of the top ten peak hours have occurred in the first week of July and collectively IWT contributed 0.9% of their overall capacity during those five hours and only 1,9% of total demand.  What that implies is IWT without 99.9% back-up from reliable generation sources would leave us all sweating in the dark without air conditioning!

Hydro makes wind and solar look expensive and pretty useless

My friend Scott Luft recently posted an excellent chart on his Facebook page showing: generation by source, costs and curtailment for the first six months of each year starting with 2008.  Looking only at the 2020 data by itself is an interesting exercise in that hydro contributed 19,396 GWh (gigawatt hours), wind 7,140 GWh and solar 2,037 GWh.  It is worth noting hydro provided Ontario’s electricity system with 111.4% more power than both wind and solar combined and the average cost of hydro’s power was $59.24/MWh whereas the average cost of wind and solar was $213.69/MWh or 360% more costly. The total cost of the combined wind and solar generation was $1.961 billion versus $1.149 billion for hydro.  If one goes further Scott notes exports were 11,598 GWh so the combined generation of wind and solar represents 79.1% of those exports.  Those exports generated revenue of $17.87/MWh and if all the wind and solar (9,177 GWh) were a part of those exports the net costs to Ontario’s ratepayers and taxpayers would be approximately $1.8 billion (wind and solar related only) and that is just for the first six months of 2020.

With that cost of $1.8 billion highlighted in the foregoing paragraph I personally hope those of you who read this will forgive my rants and start ranting with me and the others who do the same!

Time for Premier Ford to fix this mess if he wants our economy to recover!

*What 102,000 average households would use over 3 months.

No More “Carrot and Stick” requirements for Class A Ontario Ratepayers

Recently, Steven Del Duca, leader of the Ontario Liberal Party (OLP) was interviewed on NewsTalk 960 AM by Marc Patrone. While the interview dealt principally with the Covid-19 pandemic at long term care homes, near the end, Marc asked a few questions related to the “electricity” sector which resulted in Del Duca’s berating the Ford government for cancelling some renewable energy contracts at a reputed cost of $200 million.  When Marc then asked about the “gas plant moves” Del Duca’s response was to start dancing and he seemed unable to justify the money wasted when the Liberals held power saying; “it’s complicated, it’s complex”!

The ratepayers and taxpayers of Ontario are certainly aware of the complications and complexities of the electricity bills they receive and most blame the OLP for that.  They were the ruling party who created the GEA in 2009 granting expensive 20-year contracts to wind and solar companies (mainly foreign) that drove up electricity prices. Those contracts negatively affected the ability of large, medium and small companies in the province, resulting in veiled threats from large multinational companies saying they would be forced to leave the province due to the cost of electricity.  Those large corporations via the Association of Major Power Consumers of Ontario (AMPCO) commenced lobbying the McGuinty led government as soon as they saw electricity prices start their climb.

AMPCO were successful as Brad Duguid, Minister of Energy on March 4, 2010 instructed the Ontario Power Authority “to undertake the responsibility for creating and delivering an industrial energy efficiency program (the “Program”) with the objective of achieving cost-effective conservation through industrial process improvements that bring energy efficiency gains.”  Needless to say, the OPA did as told and created the Industrial Conservation Initiative (ICI) allowing large industrial users to reduce their demand by picking five (5) peak hours over the year in order to be granted a reduction in the Global Adjustment by reducing demand during those five hours.  The ICI took effect in September 2011 for the benefit of the AMPCO members who were then classified as Class A ratepayers with the rest us now referenced as Class B.  Minister Duguid’s letter to the OPA indicated up to $660 million could be handed out as “incentive funding to Participating Consumers. Incentives shall be sufficient to generate attractive rates of investment return for Participating Consumers in projects that meet the objective of achieving cost effective conservation.”  Many used those funds to invest in load displacement generation (eg: gas generators) so they could continue to operate during peak hours.

As recently noted by my friend Scott Luft, since the ICI inception in late 2011 through to the end of 2019 the cost to Class B ratepayers was approximately $1.4 billion (average of about $170 million per annum) paid to reduce the GA for those large industrial ratepayers as his recent chart shows.

Running the Class B to Class A transfer for 2019 shows the GA for Class B ratepayers was $108/MWh whereas for Class A ratepayers it was $49.63/MWh making the overall cost to Class B ratepayers just over $200 million for the 40 TWh (terawatt hours) Class A ratepayers consumed. It is worth noting the lower the HOEP (hourly Ontario electricity price) market price is during a month, the higher the B to A subsidy becomes.

The reduced consumption we are experiencing due to the Covid-19 pandemic lock-down has exacerbated the province’s surplus generation causing us to not only export more but also to curtail more wind, spill more hydro and steam-off more nuclear.  One would expect the added surplus would reduce the HOEP as it does when consumption falls and therefore benefits Class A ratepayers.

Undisclosed Class A Stable Electricity Pricing

Recognizing the foregoing Class B to Class A subsidy it came as a complete shock to note a press release was issued at 3.30 PM, Friday June 26,2020 by the Ministry of Energy, Northern Development and Mines, Greg Rickford, announcing the province would provide “Stable Electricity Pricing for Industrial and Commercial Companies”!   The reason for this unexpected late Friday announcement appears to be a concern that peak hours occur during the summer and the Ministry suggests “these large employers can focus on getting their operations back up and running at full tilt.” Instead of “adjusting operations in response to peak electricity demand hours.

What is disturbing about the press release is that it doesn’t disclose what the rate freeze has been set at nor does it disclose the estimated cost and who will bear it!

Will the cost of the freeze be layered onto all of the residential and small/medium sized ratepayers or will it be the taxpayers picking up the costs? Did AMPCO successfully lobby for this rate freeze and abolition of the requirement to increase their members conservation efforts?

While most Ontarians recognize the electricity portfolio is indeed both “complicated” and “complex” this action by the Ministry only adds to it!

Time for the Ford led government to fix the mess in this Ministry and not give the Liberals further ammunition to suggest; “it’s complicated, it’s complex”!

Another Weekend Proves Wind and Solar Drive up Electricity Costs

A post a month ago focused on the $50 million excess cost of renewable energy (wind and solar) on the Victoria Day weekend. Now with summer finally arriving and warmer temperatures, it is perhaps worth comparing the past weekend to that one by examining the performance of wind and solar and its costs.

The inevitable happens in Ontario as demand for electricity during Ontario’s mild spring and fall seasons drops from both winter and summer demand.  As noted in the earlier article average Ontario demand over the three days of the Victoria weekend was only 294,668 MWh whereas over the past weekend (including Friday June 19th) average demand was 401,336 MWh an increase of 36.2%. Demand obviously increases as warmer weather arrives and air conditioners are turned on.  This has been augmented by government and other employees working from home due to the lock-down associated with Covid-19.

The Victoria Day weekend saw wind delivering almost 133,000 MWh (plus 59,100 MWh curtailed) and solar 36,000 MWh causing net exports to soar to 264,000 MWh principally due to their excess generation.

This past weekend net exports were 84,500 MWh as wind produced only 29,500 MWh (9.1% of capacity) and solar 58,200 MWh (31% of capacity).  Increased demand coupled with the drop in wind and solar (combined) generation not only caused our net exports to fall but also resulted in the HOEP (market price) increasing from $1.16/MWh to $17.34/MWh.   What the latter means; we recovered $1.5 million more of our costs despite exporting much less (179,500 MWh less) this past weekend demonstrating wind’s habit of generating power when it’s not needed.

Ontario’s peak demand hour during this recent weekend appears to have occurred June 20th at hour 18 when it reached 19,997 MWh.  During that hour wind generated 226 MWh and solar 124 MWh or 1.7% of demand demonstrating their inability to deliver power when needed.  Needless to say; nuclear, hydro and gas delivered what we needed!

So, the inevitable question is; did increased consumption drive up our average costs as one would expect?  One would assume it would because the average price paid for solar is $448/MWh so the 58,200 MWh delivered cost Ontario ratepayers approximately $26 million and the 29,500 MWh of wind ($135/MWh) added $4 million. That brings the two generation source’s costs to $30 million over the three days and allowing for the recovery of the $1.5 million for their sale means a net cost of $28.5* million or $21.5 million less than the Victoria Day weekend. The foregoing occurred even though consumption was up 36%. Despite the reduction in costs for the recent weekend it still amounts to $9.5 million per day and extrapolated over a year would amount to $3.5 billion which coincidentally is close to what wind and solar’s costs were in 2019 as outlined in a recent post.

The conclusion:

Using more power costs less, when wind and solar generation falls!  That implies wind and solar** should be completely eliminated due to their intermittent and unreliable generation.

*The 87,700 MWh delivered by wind and solar collectively cost ratepayers 324.97/MWh or 32.5cents/kWh.

** They may work for off-grid locations subject to storage availability.

The Ongoing McGuinty GEA Ratepayer Financial Crisis Continues as the OEB releases the 2019 Electricity Supply-Mix

If one is inclined to have a concern about electricity costs and is intent on locating information it is truly disappointing that IESO, who control our grid, issue their annual report with limited information. Even though IESO are responsible for financially settling with all LDC (local distribution companies) for generation from DX (distribution connected) FIT contracted generators they appear unable to  include that generation in their “Year in Review” report.  Their report is released in mid-January.

The IESO report, as noted, doesn’t include DX generation and one must wait another five months or more until the OEB releases what they call; “Ontario’s System-Wide Electricity Supply Mix: 2019 Data”. The OEB released their 2019 review June 18, 2020 and it includes TX (transmission connected) and DX generation by source.  As a matter of interest my friend, Scott Luft does the same thing utilizing IESO Data and estimates, but his reports are issued mere days after the month or year-end.  The OEB report generally confirms his estimates.

So now that the “official” OEB Data is out let’s have a look at some of the information affecting our electricity bills.

Total generation in 2019 was 155.2 TWh (terawatt hours) with nuclear generating 90.4 TWh (58.2%) and hydro 37.2 TWh (24%).  In 2019 we exported 19.8 TWh of our generation to our neighbours in NY, Michigan, Quebec, etc. and they bought it for the average price of 1.83 cents/kWh meaning it generated approximately $360 million in revenue.  If one deducts the exported generation of 19.8 TWh from total generation of 155.2 TWh it indicates Ontario ratepayers consumed 135.4 TWh so nuclear and hydro alone could have supplied 94.2% of all our needs.  Interestingly enough, in 2019 OPG spilled 3.3 TWh of hydro and IESO’s year-end report indicated due to SBG (surplus baseload generation) there were 292 nuclear maneuvers and two (2) nuclear shutdowns. Natural gas plants provided 9.5 TWh so those three sources of generation could have easily supplied all of Ontario’s ratepayer needs.

As noted in the preceding paragraph we exported 19.8 TWh at a very low price but the information from both IESO and the OEB don’t specify the source of the generation exported. If one assumes what we didn’t need was wind and solar (generated and curtailed) the 12.7 TWh of wind plus it’s 2.6 TWh curtailed added to the 3.7 TWh of solar generation coincidentally totals 19 TWh or almost 100% of what we exported for pennies!

Wind and solar costs for 2019 came to about $3.6 billion for which we received only $360 million meaning our exports cost Ontario ratepayers in excess of $3.2 billion and that’s for only one year.  Combined the 16.4 TWh supplied intermittently by wind and solar cost 19.5 cents/kWh or 10.6 times what we sold it for!  Repeating that over the 20-year contract terms granted to renewable energy would remove $64 billion of after-tax dollars from the pockets of ratepayers.

Someone is benefiting from those GEA contracts but it sure isn’t Ontario’s ratepayers!

The Ford government should have utilized the “force majeure” clause in the contracts as soon as the Covid-19 pandemic lock-down was decreed by the Trudeau led Federal government as 2020’s costs will likely be even higher.  The pandemic has resulted in Ontario ratepayers consuming less.

OPG reports 1st Quarter Net Revenue Growth of 22.6% and No One Noticed

The 2020 1st Quarter results by OPG were reported May 12, 2020 and showed  their “gross margin” (revenue less fuel expense) increased $289 million or 22.6% over the comparable 2019 Quarter.  Net profit was up $96 million (+45%) to $309 million but the MSM didn’t notice as they were no doubt busy reporting on the pandemic and ignoring any other news!

Net Generation was up 1.6 TWh and 1.3 TWh of the addition came from the nuclear sector (up from 9.8 TWh to 11.1 TWh) and was the primary reason for the increased revenue.  The nuclear generation also included an increase per MWh delivered; jumping from 89.70/MWh to 94.96/MWh and added $58.3 million to revenue while fuel expenses increased by only $6 million.  Gross revenue from nuclear generation increased by $242 million.

Hydro generation was flat in comparison with the prior year at 8.2 TWh and a revenue gain of $11 million was due to a slight increase in an OEB approved rate application.  OPG also spilled 0.7 TWh in 2020 versus 0.3 TWh in 2019 adding about $20 million to revenue.  One should correctly assume the spilling of hydro in both years was caused by SBG (surplus baseload generation) as industrial wind turbines or solar panels delivered power when it wasn’t needed! In the past OPG wasn’t paid for spilling hydro but when wind and solar were found to reduce OPG’s revenue because of wind and solar’s “first to the grid” rights, OPG complained.  They got the McGuinty/Wynne led OLP and the OEB to agree and since 2011 Ontario ratepayers have paid for double and often triple the cost of power.  The tripling comes from gas plants whose primary purpose is to provide peaking power to back-up to wind and solar when there is no wind or sunshine.  Gas plants are paid to idle and OPG is paid to spill hydro!

Now if one does the simple math to determine the cost to ratepayers for a single kWh (kilowatt hour) in the 2020 first quarter delivered by OPG simply divide the “revenue” by the TWh delivered! For the first quarter of 2019 it is $1,426 million divided by 19.1 TWh indicating an average cost of $74.66/MWh or 7.5 cents/kWh.  For 2020 revenue was $1,720 million so dividing that by 20.7 TWh produces an average cost of $82.81/MWh or 8.3 cents/kWh.  That implies a year over year increase of $8.15/MWh which translates to a jump of 10.9 % for each and every kilowatt hour consumed. This additional cost comes in the middle of the Covid-19 pandemic so has serious implications on affordability as many from the private sector struggle with simply trying to economically survive.  If it doesn’t hit the ratepayers it will surely hit the taxpayers as the Ford government has either decreed it will be deferred or taxpayers will pick up the costs.

If it is any consolation, OPG is 100% owned by the province (we are the shareholders) so the net profit of $309 million and the $87 million in taxes (actually they are “payments in lieu of taxes) contributes $396 million to the provincial treasury.  On top of that the hydro “fuel costs” used to generate the 8.2 TWh of hydro was $67 million and will allow the provincial treasury to record revenue from OPG of $463 million for just one quarter. That money comes from the pockets of the ratepayers of the province and will clearly help to supplement the “Ontario Electricity Rebate” program.

As a ratepayer/taxpayer it is both annoying and expensive to realize we pay for unreliable wind and solar generation as well as spilled hydro and those idling gas plants needed to back-up them up!

The time has come to recognize the facts and cancel wind and solar contracts or only pay them when they deliver NEEDED power.  That action would help keep OPG’s rates down at the same time.

Ontario’s lavish, expensive electricity weekend

Enjoy the weekend and the balmy weather? Good: you paid millions for it.

Live it up, baby

Ontarians waited a while for Mother Nature to bless them with a good weekend and it finally happened. June 8th and 9th were beautiful days filled with sunshine and temperatures that were warm but not hot.   A nice breeze added to the two spring days.

So, while Mother Nature treated us nicely, that meant people were out enjoying the weather and electricity consumption was, as it usually is during the Spring and Fall, low. Consumption at its lowest (Ontario demand) point over the weekend was 10,564 MW during one hour, and average Ontario demand over the 48 hours was a very low 12,975 MW*.

The combination of nice weather and low electricity consumption however, created an expensive weekend for Ontario ratepayers. Those breezes were generating surplus wind power from industrial wind turbines and water was flowing through our rivers and through and over our dams. The combination cost Ontario ratepayers lots!

For example, wind which delivered 39,870 MWh but the IESO (Independent Electricity System Operator) was, at the same time, getting IWT to curtail wind — that amounted to 58,870 MWh**. Those wind power operators were paid $120.00/MWh for curtailed wind and $135.00/MWh for grid-accepted wind.

Wind at 3.7 cents a kilowatt hour? How about 31?

So, collectively over the two days, wind generation and its curtailment alone cost ratepayer $12.448 million or over $312.00/MWh (31.2 cents/KWh).

Over those same two days our net exports (exports minus imports) were 123,960 MWh and most of it was sold at negative prices.   Those 123,960 exported MWh cost Ontario’s ratepayers an average price in excess of $115/MWH, so that was another $14.3 million added to the weekend’s expenses!

It also appears IESO were spilling quite a bit of hydro as well. Scott Luft estimates hydro spillage was somewhere around 50,000 MWh** which would add a further $2.3 million to our expensive weekend.

As if these costs weren’t enough, we also shut one nuclear plant down early Saturday morning and steamed-off nuclear power at Bruce Nuclear — that resulted in another waste of around 43,700 MWh at a cost of $2.884 million which Ontario’s ratepayers are obliged to pay.

And just to put some icing on the cake, our 7,925 MW of gas plants (backing up renewable intermittent wind and solar generation) were idling all weekend at a cost (estimated) of $10,000 per MW of capacity per month. That cost ratepayers about $5.2 million for those two days.

So add up the waste of the two days for curtailed wind of 58,870 MWh, steamed-off nuclear of 50,000 MWh, spilled hydro of 43,700 MWh and net exports of 123,960 MWh you will see Ontario’s ratepayers will pay for 276,530 MWh of unneeded power, or 44.4% of what was actually consumed.

That’s almost $26 million. For one weekend.

If one includes idling gas plants, total costs were north of $31 million to be paid for, but provided absolutely no benefit to Ontario ratepayers!

PARKER GALLANT

*Nuclear power alone could have supplied about 85% of total consumption over the 48 hours.

**Thanks to Scott Luft for this information.

Why warm breezy spring days are horrible for Ontario

but New York and Michigan think they’re great. 

The Victoria Day weekend often brings nice weather and the recent weekend was no exception in Ontario.  Sunday was a beautiful day in most of the province, with temperatures in the high teens to low twenties.

Pleasant, but if you are an electricity customer? Horrible.

As a direct result of that really nice day on May 19, Ontario’s demand for electricity was low — according to IESO’s daily summary demand was just under 296,000 MWh.   Ontario’s nuclear plants combined with a little bit of hydro could easily have supplied all our electricity needs that day.

But, the wind was blowing and according to IESO’s forecast was expected to generate over 59,200 MWh of power or about 20% of Ontario’s demand.  Even though wind generation gets “first-to-the-grid” rights (because of the contracts the wind industry negotiated) the IESO only accepted 40% (23,700 MWh) of the forecast amount, presumably at standard contracted price of $135/MWh (plus cost of living increases since contract signing).

IESO curtailed the balance of 35,500 MWh and paid the CanWEA-negotiated price of $120/MWH.

So the total cost of power generation from wind was almost $7.5 million or about $315/MWH — about 31.5 cents/kWh.

As if that wasn’t bad enough, IESO were busy selling off surplus generation to our neighbours. Cheap.

Our net exports (exports minus imports) averaged 2,860/MWh for 24 hours, meaning net exports for the day were just over 68,600 MWh.  As a reminder, exports are sold at the market price or what is referred to as HOEP (Hourly Ontario Energy Price) and that averaged -$2.16 (negative) for the day, meaning it cost us about $150,000 to just get rid of our surplus power on top of paying for the HOEP and the GA (Global Adjustment).

The IESO in their April 2019 monthly summary said the combined HOEP and GA cost averaged $116.77/MWh* up to that date.  A quick calculation on this indicates Ontario’s ratepayers picked up costs of $8,150,000 for power shipped off (via transmission lines we pay for too) to New York (31,160 MWh), Michigan (19,180), Quebec, etc. That helps them to keep their costs down.

In summary, Ontario’s ratepayers picked up the costs for wind generation and curtailment of $7.5 million together with the cost of exports of $8.150 million without inclusion of solar, hydro spillage and nuclear steam-off costs. While we may have been outside enjoying a nice sunny spring day, Ontario’s ratepayers were being treated as scapegoats for the mess that permeates the electricity system.

The total damage was $15,650,000 for just one day.

This waste is offensive to both ratepayers and taxpayers — the time has come to stop.

PARKER GALLANT

*Scott Luft reported April set a new record for Class B ratepayers which IESO said was $138.90/MWH

Should the Pickering nuclear plant be closed? Not based on cost and performance…

Pickering: working at 95% capacity during the heat wave [Photo: OPG]
July 6, 2018

Wind power a failure during recent high demand during heat wave; dependable power needed

I got a call at 11 a.m. on June 25th from the producer of the Scott Thompson show on CHML 900 AM to appear on the show to discuss the suggestion by NDP leader Andrea Horwath about closing the Pickering Nuclear plant.

Essentially it was about her statement during the election campaign indicating the NDP’s position on Pickering:  “we will begin the decommissioning process immediately, which will bring more jobs to the area — as opposed to the Liberal plan, which is to mothball that facility for 30 years and allow the next generation to figure out the decommissioning”.

Doug Ford, leader of the Ontario Progressive Conservatives, on the other hand stated: “The Pickering plant can continue to safely operate until at least 2024. We can generate 14 per cent of Ontario’s power needs right here”.

The producer suggested Scott wanted to explore the opposing issues with me.

Aware I was scheduled to be on his show at 12:35 p.m., and remembering that a Brady Yauch article a few months earlier in the Financial Post had suggested closing Pickering, I felt I should do more research before the call back.  Brady’s principal point was Pickering was a poor performer and the estimated costs ($300 million) of the extension would prove to be negative for ratepayers.

OPG’s website describes Pickering as follows: “Pickering Nuclear has six operating CANDU® (CANadian Deuterium Uranium) reactors. The station has a total output of 3,100 megawatts (MW) which is enough to serve a city of one and a half million people, and about 14 per cent of Ontario’s electricity needs.”.

Pickering Nuclear traces its roots back to 1971 when it first commenced operation with four units and expanded to eight units in 1983.  Two of the first four units have been in voluntary lay-up since 1997.  The CNSC (Canadian Nuclear Safety Commission) awarded OPG’s Pickering and Darlington nuclear stations its highest safety rating in 2017.

Combined, the Pickering and Darlington nuclear stations generated 10.4 TWh (terawatts) of power for the 1st Quarter of 2018 at a combined cost of 7.2 cents/kWh (up from 5.8 cents/kWh in the comparable quarter).  The 10.4 TWh was sufficient to supply the 4.6 million average residential households in the province.

Directing my research to IESO’s hourly Generator Report I was able to discern Pickering at hour 10 of June 25th had just generated 2,308 MWh out of 10,457 MWh produced by all the nuclear plants in the province.  Pickering nuclear represented 22% of nuclear generation at that hour, 15.6% of Ontario demand and 14% of total demand (including exports).   At hour 10, wind turbines were generating 452 MWh or 10% of their capacity versus Pickering nuclear which was operating at about 74.5% of its capacity.

Both nuclear and wind are classified as “base-load” generation!

As it turned out, when I was on Scott’s show the bulk of our chat was related to his prior guest’s discussions about Premier Ford’s cancellation of the “cap and trade” tax.  Only a couple of questions were raised about Pickering which I responded to.

Interestingly enough, now that the Ontario July heat wave has passed, I felt the urge to look at the performance of Pickering and IWT over the seven days when peak demand was high.  Pickering nuclear performed well generating close to 3,000 MWh each and every hour over the period meaning it was operating at over 95% of capacity.  Wind power generation, however was all over the map reaching a high of 2,769 MWh (62% of capacity) at midnight July 1st and a low of 5 MWh (0.11% of capacity) at 10AM on July 4th!

It is obvious that wind fails miserably as “base-load” generation when needed and the relative cost of generating power (sans back-up costs) is over 17 cents/kWh.

It sure looks like we should keep Pickering nuclear operating, as Premier Ford suggested.

Parker Gallant