May 12th and 13th,2024 has come and gone and with it those IWT (industrial wind turbines) owners grabbed $10.8 million of our after-tax dollars we Ontario ratepayers and taxpayers supplied.
While the foregoing was happening our neighbours in Michigan, New York and Quebec were happy to receive really cheap electricity generation we didn’t need due to those IWT generating unneeded power in their intermittent and unreliable way.
In total over the two days our interties (net exports) delivered 127,059 MWh (what 2.1 million average Ontario homes would consume) to our neighbours for pennies of their actual costs based on the average of the HOEP trading price (hourly Ontario energy price) over those two days. The HOEP averaged $19.31/MWh on May 12th and $19.46/MWh on May 13th or 1.9 cents/kWh on both days.
Of the total net exports of 127,059 MWh sold over the two days it appears IWT generated 89,590 MW accepted by IESO due to their “first-to-the-grid” rights and another 3,801 MW were curtailed. For that reason, we can surely lay the blame on those IWT for generating 73.5% of the unneeded power we basically gave away! That unneeded power from the IWT also substantially impacted the traded cost of the power reducing it to the above levels of 1.9 cents/kWh probably meaning other power such as baseload nuclear was also exported at less then its cost.
In respect to the latter for some time three of the Bruce nuclear plants were undergoing VBO (vacuum building outage) but came back online over the past few days, increasing baseload nuclear capacity by approximately 2,400 MW or around an additional 57,600 MW per day. IESO wisely allowed them to be taken offline for the VBO process during the time of year when demand is lowest! This time of year however, is the also the time of year when those IWT frequently provide their highest generation levels.
To put the foregoing in context on May 12th those IWT operated at 25.9% of their capacity and on May 13th they were projected to operate at 54.4% but because IESO curtailed some of their forecasted generation they operated at 50.2%.
To support the foregoing comment, the peak demand hour on May 12th reached only 14,615 MW and on May 13th (a work day) only 15,980 MW whereas during the warm or hot summer days it is frequently around 20,000 MW or even higher. During those hot days however, it is the time of year when those IWT only operate at an average of 15% of their capacity and often at less then 5%! It is also the time of the year when our natural gas plants frequently come to the rescue to keep the lights on and the air conditioning units running.
Conclusion
If we look at the costs over the two days and what was curtailed, just the IWT generation collectively represented a total cost to us ratepayers/taxpayers in Ontario of $10.8 million for power, we didn’t need! We Ontario ratepayers and taxpayers will be delighted when those IWT contracts finally expire and help to reduce the costs of our electricity!
Well, there it was in black and white with UN Secretary-General Guterres calling for “no new coal” but also for eliminating its use in rich countries by 2030 and poor countries by 2040. He urged carbon-free electricity generation in the developed world by 2035, meaning no gas-fired power plants, either.“ The foregoing was from a CBC article of March 20, 2023, when Guterres was screaming about ensuring we kept the global temperature increase below that magical 1.5 C limit!
Later in 2023 at the opening launch of the UNIPCC (United Networks Intention for Poverty Creation ConclusionsNB:)Convention, Guterres stated: “Inch-by-inch progress will not do. It is time for a climate ambition supernova in every country, city and sector.“
So, we should wonder, how is that “no new coal” push working out, particularly after NATO’s action on Russia occurring shortly after Russia launched it’s attach on the Ukraine on February 24, 2022?
NATO’s action on Russia
An excellent Joe Blogs You Tube video came my way and while somewhat lengthy it was filled with facts and charts related to the effects of NATO’s declaration in respect to Russia’s fossil-fuel exports after their invasion of the Ukraine. The various charts in the video highlights how coal consumption has tracked.
The following chart indicated that coal consumption dropped somewhat back in 2019 due to the Covid impact but since then has increased to record levels.
Another chart highlights how global coal-fired electricity generation hit a new high in 2023 in spite of Guterres scream about “no new coal”!
To put the above in context note that Canada total electricity generation in 2023 was 613 TWh (7.3%) and coal generation represented less than 5% or about 30 TWh of the 613 TWh.
Now, should one wonder which countries mine coal the following chart contains those with the highest production levels.
The below chart indicates where Russia’s coal exports are destined for and it is easy to note that China has replaced the EU as the major purchaser since the invasion of the Ukraine .
As a matter of further interest China consumes 4.3 billion tonnes of coal annually which is more then the other nine (9) countries gobally of the top ten (10) coal consumers.
Video Summary:
The summary of the video indicates the US and other developed counties have declared sactions against the two largest Russian coal export companies. As a result both China and India have started to reduce their purhases at the start of 2024 as there is concern they could both face secondary sanctions from the countries who are their largest export markets.
Quite the squeeze on Russian and both China and India are now busy trying to secure coal from other countries to replace Russian coal but we should presume Canada won’t be among them!
Other Coal News:
Canada: Canada’s thermal coal exports in 2023 were up seven per cent to 19.5 million tons despite the Liberals promise three years ago to end all exports by 2030. About half of those exports were mined in the US but because most US west coast ports won’t allow thermal coal exports they are shipped to Vancouver and Prince Rupert terminals by rail for export. Needless to say, eco-warriors such as Ecojustice are upset but “Environment Minister Steven Guilbeault said last month he expects to announce a plan to phase out coal exports later this year.“
India: India has plans to expand its steel production and that will result in them becoming “thelargest seaborne coking coal buyer, a trend driven by the country’s growing steel capacity and consumption. India aims to raise its steel capacity to 300 million mt per year by 2030, up 71% from 2023.“ Interestingly their largest supplier is Australia but they are looking to other markets such as the USA and Russia to provide future supplies.
Vietnam: Vietnam depends on coal fired electricity and has experienced power outages caused by heat waves so it’s principal coal miner has boosted sales at the same time as the country will increase its imports. “Coal-fired power plants account for 37.5 per cent of Vietnam’s total installed power generation” and during heatwave generation has reached 67%.
Coal News Summary:
The above highlights demand in only a few countries but as is obvious many Asian countries are increaing their coal generation of electricity as well as steel production so Canada’s proposed ceasing of our exports will have no affect on reducing global GHG except to reduce Canadian jobs associated with coal mining as well as the ports where they are exported!
Canada’s Natural Gas and Liquid Natural Gas (LNG)
Canada is ranked fifth in the world in respect to natural gas production and reserves and most of what we produce is exported to the US. In 2023 our natural gas exports generated $13.10 billion and our imports of it (mainly to the Atlantic provinces) cost $3.18 billion meaning it contributed almost $10 billion to our international trade balance while generating good jobs and warming millions of Canadian households during our cold winters. What Canada does little of with natural gas is to liquifiy it as LNG for shipments outside of pipelines but we certainly have had an opportunity to do so. Here are three examples!
First Germany asked for LNG during a visit to Canada in August 2022 but our PM, “Trudeau said there isn’t a clear business case yet for building a liquefied natural gas (LNG) export terminal in Saint John or elsewhere.“
The second request for LNG came from Japan but again “Japan has “high expectations” for getting natural gas from Canada, but Prime Minister Justin Trudeau made no new commitments to increase exports during meetings with Japanese Prime Minister Fumio Kishida on Thursday. “
Then Greece came looking for LNG but; “For the third time in 18 months, a foreign head of government has made a rare visit to Canada with the stated intention of buying billions of dollars in natural gas. And for the third consecutive time, the official answer from the Trudeau government appears to be “no.”This time around the visitor was Greece Prime Minister Kyriakos Mitsotakis, who was the first Greek leader to come to Canada in more than 40 years.“
Conclusion
The following chart from the Global LNG outlook for 2024-2028 provides the list of countries globally with LNG exports for 2023!
It is obvious that Canada, with our fifth place in both natural gas reserves and generation, could economically benefit substantially if our Prime Minister wasn’t so taken with his push to destroy the benefits fossil fuels bring to our country. I personally have a firm belief we could easily become one of the top five LNG exporters if we eventually elect a governing party who is not out to destroy our beloved country!
Wow, May 7th came and went and no blackouts throughout the province were in evidence. We should all be thankful that as is generally the case in the Spring and Fall, electricity demand in Ontario is in the lower demand level for the year ranging from only 12,000 MW in the night reaching a high in the 16,000 MW range at our peak hour.
The summer highs reaching 22,000 MW are a month or so away, so it is a bit worrisome that at the present time 60.5% (7,950 MW) of Ontario’s nuclear capacity is out for refurbishment or VBO (vacuum building outage) reasons! Nevertheless we once again survived the day! We survived the day as both hydro and natural gas generation stepped up to ensure the lights stayed on even though peak demand at hour 20 reached 15,695 MW.
Over the day the existing nuclear capacity of 5,194 MW produced 124,297 MWh and ran at 99.7% of their rated capacity. The strange happening however, was, Ontario’s hydro power for 22 of the 24 hours actually generated more power then nuclear produced and for the full day generated more then nuclear at 132,335 MWh. That hydro generation surely helped to keep the lights on and our businesses operating. To top off what hydro generation provided, our national gas plants, which the OCAA (Ontario Clean Air Alliance), a member of the “Church of the Climate Cult” want shut down; generated 79,438 MWh to ensure we had the required power needed throughout the day ramping up and down as demand fluctuated!
What is amazing about how the day unfolded is that IESO were still busy selling off our surplus generation to Michigan and Quebec with a small amount to New York via our intertie connections. In total our net-exports were 39,107 MWh and at hour 16 with the net sale of 1814 MW the HOEP (hourly price), IESO were paid, was $454.37/MW or 45.4 cents/kWh and it presumably included the 654 MW of IWT (industrial wind turbines) generation it produced at that hour!
Excluding the foregoing hour the average sale price for the day was $32.82/MWh but including it raises the net sale price to $50.39/MWh! What was somewhat unusual is that while Quebec was the principal buyer of the surplus generation throughout much of the day, during hours 17 to 21, Ontario actually were net importers of 1,133 MW from them but perhaps IESO were just ensuring we needed that power to avoid a blackout during those usual higher demand hours!
The foregoing 39,107 MWh (net-exports) sold probably was, principally, a result of those IWT generating 27,540 MWh while operating at 23.4% of their capacity throughout the day. Those IWT have the benefit of “first-to-the-grid” contract rights ($135/MWh) so IESO accepted all of their generation as their sale price exceeded the $15/MWh they could have saved from having them curtail their power.
Conclusion
It seems obvious IESO has logically picked the best time to allow the nuclear plants to conduct their VBO, pinning their hopes on no unusual weather that would drive demand higher than it has been for the past several days.
Let’s all “cross our fingers” in support of their plan but don’t count on either wind or solar generation to step up in the event we get any unusual weather!
As noted in a recent article the Ontario Minister of Energy, Todd Smith announced the possibility of a discount for charging your EV (electric vehicle) but he better hold off for quite a while.
Yesterday, May 5th was a clear demonstration why he should hold off as 59.4% of Ontario’s nuclear capacity is either down for full refurbishment or VBO (vacuum building outage). What that means is Ontario’s current grid connected capacity is without 7,810 MW of that reliable nuclear power that when grid connected, operates 24 hours daily.
Should Ontarians suddenly endorse EV in a big way and need to charge them on a regular basis it could bring about a demand that the grid will be unable to handle, and we may then experience rolling blackouts. We ratepayers should be thankful most Ontarians have not been sold on the reputed wonders of EV to reduce our CO 2 emissions!
Yesterday, Ontario’s hydro capacity (7,375 MW) which, unlike nuclear can ramp up and down, actually generated more power than nuclear for 8 hours of the day. As frequently occurs during our spring and fall days demand was quite low and only reached 15,185 MW at hour 20 (hour ending at 8 PM) and for most of the day was well under 14K MW and as low as 11,158 MW during our nighttime!
Thankfully Ontario has 8,711 MW of natural gas capacity which like hydro also can ramp up or down as needed so it generated power during the higher demand hours!
We also have 4,936 MW of IWT capacity, and 436 MW of solar capacity connected to our grid, but it cannot be ramped up when needed if there is no wind blowing or the sun isn’t shining but we are obliged to accept all of IWT’s generation when the wind is blowing!
As a result of the low demand yesterday but, fortunately a low wind day, those IWT only generated 28,146 MWh or 23.9% of their capacity however it wasn’t needed! Despite the foregoing the “first-to-the-grid” rights of their contracts required IESO to either accept them or have them curtailed. Curtailing wind only saves us ratepayers $15/MWh so IESO will sell off the surplus power to our neighbours should the average market price exceed that $15/MW which it did yesterday averaging $24.73/MWh!
While IESO actually reported net-exports totaled 37,104 MW we should assume all of that IWT generation wasn’t needed but it cost us $135/MWh, so Ontario ratepayers picked up the cost which was $4.8 million but IESO only earned $800 thousand from its sale meaning the remaining $4 million became a cost to us Ontario ratepayers and taxpayers.
Conclusion
Let’s keep our fingers crossed that those nuclear plants will return before the high demand days arrive on our hot summer days and well before EV adoption increases!
The pro-Hamas camp now ensconced at McGill University in Montreal brought back memories!
Those memories were related to how our Prime Minister, Justin Trudeau and his buddy, Gerald Butts became strong friends when they both attended McGill U. as the following picture suggests.
Damage to Ontario
Those of us living in Ontario are paying the price for the time spent by Butts influencing Dalton McGuinty during the days when he was Premier and Butts was his “principal secretary” and “policy guru” as noted in an article in the CBC from December 7, 2016.
The author of the CBC article points out how Butts took credit for the Green Energy Act’s creation which according to his biography on the WWF (World Wildlife Fund) pointed to that claim along with many others. The article went on to note how the GEA “cost Ontario consumers an extra $37 billion between 2006 and 2014, according to an auditor general, and is expected to cost another $133 billion from 2015 to 2032.“ The foregoing represents an average cost of over $6.5 billion annually until those contracts expire and close to what Ontario taxpayers are now absorbing in order to keep electricity rates from increasing even more.
Damage to Canada
As we know, Butts went on to become the “principal secretary” to Prime Minister Trudeau and was successful in “promising to enact carbon pricing regimes (read: tax) on all provinces by 2018 and phasing out coal by 2030“.
As time progressed for Butts as Trudeau’s principal secretary, he ultimately was forced to resign his position; “amid allegations that senior members of the PMO pressured former justice minister Jody Wilson-Raybould to help Quebec-based multinational engineering firm SNC-Lavalin avoid criminal prosecution on bribery and fraud charges in relation to contracts in Libya“ as noted in another CBC article from February 18, 2019.
Despite his resignation Butts can once again claim success as the Trudeau led government imposed the “carbon tax” which continues to rise every year until it reaches $170/tonne and is causing energy poverty in every province where it has been enacted!
That “carbon pricing” regime came to pass as there are economists such as Chis Ragan and others who believe taxing something will cause its demise! I authored three articles that tried to outline exactly what the “Ecofiscal Commission” was and the individuals involved in justifying their recommendations.
One can liken it to how they believe taxing alcohol and smoking reduced their consumption due to their associated health issues so presumably they believed reducing CO 2 emissions will be beneficial by taxing our energy needs when produced from fossil fuels!
They failed to look at the negative affects of eliminating the ability of those fossil fuels to provide the electricity and heat to keep us warm during our winters, cool in the summer or via their other many contributions such as keeping us healthy with medical supplies and with fertilizers for our farmers to grow food!
Eurasia Group
After Butts resigned as the principal secretary to Prime Minister Trudeau, he wound up at Eurasia Group where he now resides as their Vice Chairman and his biography brags extensively about his abilities! Just one example: “As the principal secretary to Canadian Prime Minister Justin Trudeau from 2015–2019, Gerald was responsible for providing executive direction on the development, implementation, and communication of the government’s agenda. This work included overseeing economic policy, the negotiation of the Paris climate accord, and the creation of Canada’s first national climate change plan—which included an economy-wide price on carbon.“ Beyond the foregoing it is worth noting that Eurasia Group has successfully obtained over $1 million of Government contracts!
Conclusion
The unelected “principal secretary” to both Ontario Premier, Dalton McGuinty and Prime Minister, Justin Trudeau will cost Ontario taxpayers and ratepayers $170 billion dollars but that pales beside the costs to all Canadian taxpayers and ratepayers under the claimed achievements he cites while the principal secretary to Prime Minister Justin Trudeau!
How can this ever happen in what we claim is a democracy!
It was a press release from the Ontario Minister of Energy, Todd Smith asking (nay, telling) the Ontario Energy Board “to explore options for an Electric Vehicle Charger Discount Electricity Rate as the province continues to support the adoption of electric vehicles (EV).”
Needless to say the press release goes on and on to glorify EV reminding one of old expressions such as putting “lipstick on a pig” believing it will change our beliefs and the lipstick will change our view of the pig from “ugly to pretty”!
A couple of examples follow from the press release:
1.”A new electricity rate would support electric vehicle adoption across the province by reducing the electricity costs for charging infrastructure where demand is only beginning to emerge, making them more economical.”
Presumably what the foregoing implies is that cheaper fuel costs (charging your EV) will entice more Ontarians to purchase an EV! On the other side of the road if you own or purchase an ICE vehicle you will be hammered by added costs which now include that “carbon tax” which will continue to add to those fuel costs as it increases year over year!
What is missing in the advent to “cheaper fuel costs”; implied by conversion to an EV, here in Ontariowe are many facts and costs associated with the electricity sector including:
a) increasing your home service from a 100-amp to 200 amp service, b) the electricity service on your street may require an upgrade, c) the local transformer station may also require an upgrade should EV ownership increase substantially d) lots more generation will be needed to satisfy demand. All of the foregoing will add to the costs of electricity which will impact all households and businesses either by increased electricity rates or even more than the current $7.3 billion will need to be absorbed by taxpayers.
2.“With $43 billion in new electric vehicle and EV battery manufacturing investments in Ontario’s auto sector over the last several years, our government is working to improve access to public charging infrastructure to support drivers who are making the transition to electric vehicles.”
If one follows the news and has read the November 17, 2023 press release from the PBO (Parliament Budget Office) it is interesting to note it estimated “government support” for just the battery manufacturing sector amounts to $43.6 billion which is remarkably close to what the Ontario government claims is being invested in Ontario’s auto sector.
The PBO goes on to state “We estimate the total cost of government support for EV battery manufacturing by Northvolt, Volkswagen and Stellantis-LGES to be $43.6 billion over 2022-23 to 2032-33, which is $5.8 billion higher than the $37.7 billion in announced costs,” adds Mr. Giroux. The $5.8 billion in non-announced costs represents foregone corporate income tax revenues for the federal, Ontario and Quebec governments combined.
Of the $43.6 billion in total cost, PBO estimates that $26.9 billion (62 per cent) in costs will be incurred by the federal government and $16.7 billion (38 per cent) will fall on the provincial governments of Ontario and Quebec.”
What the PBO report notes is that not only are we Canadian and Ontario taxpayers providing huge subsidies for those investments but at the same time we are granting them tax free status.
The PBO press release goes on to specify “Of the $43.6 billion in total cost, PBO estimates that $26.9 billion (62 per cent) in costs will be incurred by the federal government and $16.7 billion (38 per cent) will fall on the provincial governments of Ontario and Quebec.“ The PBO goes on stating; “We estimate a break-even timeline of 15 years for the $13.2 billion production subsidy announced for Volkswagen, and 23 years for the $15.0 billion in production subsidies announced for Stellantis-LGES—consistent with our previous estimate of 20 years based on their combined production schedules”.
The foregoing suggests our current Federal and Provincial governments contain politicians we elected to see into the future!
Based on the incredible commitments being made here in Ontario and the obvious push to capture EV manufacturing we Ontarians should wonder what is the uptake of BEV and Hybrids (including plugins) when compared to ICE and Diesel sales?
Are We Buying What Politicians Are Selling?
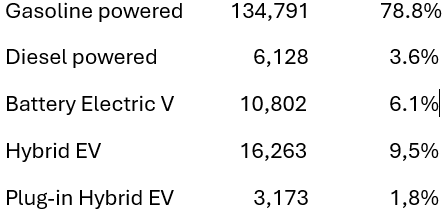
A quick review of StatsCan vehicle registrations in Ontario* for the 2023 fourth quarter disclosed there were 171,157 vehicle registrations in the province in total. The registrations break down as follows:
Conclusion
It sure appears Ontarians are not sold on the purchase of BEV whereas gasoline hybrids are much more popular but even those didn’t achieve a 10% market share. The BEV market share has not bloomed suggesting the $43 billion of taxpayer dollars handed to the auto companies are not inspiring people to purchase them.
It is looking more and more like our politicians; with blinkered foresight, don’t have an appreciation of taxpayers hard earned dollars! The time has come for them to realize they are not Nostradamus and simply manage the present system and stop gambling with our taxes!
*Ontario doesn’t offer rebates but the Federal Government grants $5,000 for the purchase of a new BEV
Those who receive media output from the OEB (Ontario Energy Board) will have recently received an e-mail notice titled “End of Winter Disconnection Ban”! It informs the reader how to avoid the disconnect by outlining the various programmes that now exist to obtain taxpayer dollars to cover the costs as well as what your local distributor can or cannot do!
We should all assume this happening is merely the “chicken coming home to roost” due to how our energy costs have been climbing steadily due to Federal, Provincial and Municipal governments having gone overboard in an effort to achieve “net-zero” to hinder or stop, what was once called “global warming” but has morphed into “climate change”!
The not-so-subtle warning from the OEB served as an enticement to go back in time to see how things once were It led to IESO’s (Independent Electricity System Operator) website where they have listed TOU (time of use) rates from 2006 through to the most recent price change effective November 1, 2023! Here are the screenshots of the November 1, 2023, and 2006 price ranges. The middle screenshot from May 1, 2018, was when the Ford led Ontario Conservative Party took over from the McGuinty/Wynne Ontario Liberal Party and in the runup to that election they promised to reduce electricity prices!
“Improved supply conditions and lower total demand in 2006 contributed to the lowest annual average weighted price since the market opened in 2002. The average price for 2006 was 4.87 cents per kilowatt hour, down 30 per cent from the previous year.“ IESO went on to note: “Ontario set a new all-time record for electricity demand of 27,005 MW on August 1, 2006. However, despite this record peak, total annual demand for electricity declined to 151 TWh, compared to 157 TWh in 2005.“
It is worth noting that daily peak demand has maintained the record since 2006 and annual demand has not reached 151 TWh since then. Perhaps the climb in the costs of electricity had something to do with that as Ontario’s population back in 2006 was lower as were the number of households which have increased from around 4.6 million to almost 5 million in 2020. We should suspect both households and the population of Ontario are undoubtedly higher today.
Time of Use (TOU) Prices Ahead of Inflation
Should one do the math on inflation rates from 2006 to 2023 we discover they increased in Ontario by 44.1% and 16.9% from 2018 which turns out to be well below the increase in TOU rates for both the McGuinty/Wynne Liberals and the Ford Conservative led governments!
Since 2006 to 2023 Off-peak rates are up by 159%, Mid-peak by 72% and On-peak by 88% so all are well above the 44.1% inflation increase we experienced in those 17 years!
From 2018 to 2023 Off-peak rates are up by 33.8%, Mid-peak by 29.8% and On-peak by 45.4% which again is well above the 16.9% overall increase in inflation rates in the past 5 years!
Should one examine which of the three TOU rates jumped the most since 2006 it is obvious the biggest increase by far was in the “off-peak” rates which co-incidentally is responsible for 60/70% of household demand. Off-peak rates apply over weekends including holidays and also apply from 7 PM in the evening to 7AM in the morning during workdays and as noted during the 2006 to 2023 timeframe those rates increased the most and usually represent over 60% of usage during a normal month.
Conclusion
It is obvious from the above information with the actual facts coming from the OEB and IESO that Ontario’s electricity rates have outstripped inflation by a significant margin since 2006 due to both the Liberal and Conservative led Provincial governments. Both the Liberals and the Conservative governing parties have chosen to allow those rates to continue climbing adding to inflation while layering on rebates for taxpayers to absorb (Ontario’s recent budget allocates $7.3 billion) and adding other programs to help those suffering from “energy poverty”!
While the Ford led government cancelled the GEGEA (Green Energy and Green Economy Act) passed by the McGuinty Government in 2009, the cancellation did absolutely nothing to reduce the cost of electricity to ratepayers who are also taxpayers. Premier Ford and his Minister of Energy continue to push the net-zero concept, presumably in support of the Federal led government, which will continue to increase the costs of what is a basic necessity. With IESO seeking increased generation and storage capacity coupled with nuclear plant refurbishments to meet those “net-zero” targets and achieve full “electrification” it is hard to visualize how they will be able to slow the increasing costs of the electricity sector down.
ACTUAL IMPACT OF CO2 EMISSIONS ON GLOBAL TEMPERATURE
WHAT YOUR GOVERNMENT AND MEDIA WON’T TELL YOU!
The public is poorly served by discussions of the benefits of emissions reductions in terms of tonnes of CO2. Citizens do not have the information to make the leap from the intermediate step of reducing CO2 emissions, measured in megatonnes, to the real goal of deferring warming, measured in degrees C. Canadians are not given “cost / benefit” analyses of carbon tax or “green energy” programs in meaningful comprehensible terms.
The purpose of this document is to provide readily understandable examples of the actual relationship between CO2 emissions and global temperature.
The table below is based on latest science as reported by the Intergovernmental Panel on Climate Change (“IPCC”). The relationship between atmospheric CO2 and temperature is very poorly understood, as is the relative contribution between man-made and natural causes. The science is not settled! IPCC estimates that the impact on temperature of a trillion tonnes of atmospheric CO2 emissions is “likely in the range of 1.0 to 2.3°C” – a very broad range indeed. This is equivalent to 0.00001 to 0.000023°C per megatonne. IPCC’s “expert opinion” suggests a “best estimate” of 1.65°C per trillion tonnes of CO2.
One way to interpret this data is that if Canada miraculously went to zero emissions overnight, the annual impact on global temperature would be 0.000904°C, or one degree Celsius in 1106 years. Global warming would continue to increase, but at an unmeasurably slower annual rate. One way to interpret this data is that if Canada miraculously went to zero emissions overnight, the annual impact on global temperature would be 0.000904°C, or one degree Celsius in 1106 years. Global warming would continue to increase, but at an unmeasurably slower annual rate. Another way to put Canada’s impact in context is to point out that recently China’s emissions increase has exceeded Canada’s annual total output every 2.4 years.
Physical impact of impact of emissions reduction:
As altitude increases, temperature decreases. As we go north further away from the equator temperature decreases on average.
Altitude, emissions reduction and temperature:
Temperature decreases with altitude. This ‘lapse rate’ averages 6.5°C / kilometer increase in height. If Canada’s emissions suddenly went to zero, the theoretical impact would be:
0.000904⁰C / 6.5°C / kilometer = 0.000139 kilometers.
This is 13.9 centimeters or 5.47 inches. If Canada’s emissions were to suddenly disappear, the climate change one would “feel” would be less than the altitude impact of climbing one step of a staircase.
Latitude, emissions reduction and temperature:
As we travel away from the equator, the climate cools. On average, the cooling rate in North America is 0.0032°C / kilometer. If Canada’s emissions suddenly went to zero, the theoretical impact would be:
0.000904⁰C / is 0.0032°C / kilometer = 0.28 kilometers
This is less than the length of three football fields. Moving north one city block would have the same annual physical impact as eliminating Canada’s total emissions.
CONCLUSIONS:
The reason your governments refuse to show impacts on temperature of emissions reduction programs and carbon taxes is simple: Canada has a small 1.5% contribution to global CO₂ emissions and current “green” technologies have a minimal impact on global temperature at an enormous cost. Yet, with an uniformed public there is a political benefit to virtue signalling – pretending that you are actually doing something meaningful to save the planet for future generations.
The recent two days in Ontario brought Spring showers and lots of IWT (industrial wind turbine) generation as the wind was blowing throughout the province. Based on IESO data it also resulted in them apparently curtailing some of its unneeded generation.
On April 22nd IESO forecast those IWT would generate 46,220 MW (39% of capacity) but curtailed 4,464 MW. Then on April 23rd IESO forecast they would generate 91,540 MW (77.8% of capacity) but again curtailed 10,288 MW. Those “first-to-the-grid” contacts resulted in the owners of the IWT receiving $135/MWh for accepted generation and $120/MWh for what was curtailed!
Over the same two days IESO data disclosed Ontario’s net-exports to our neighbours in Quebec, Michigan and New York were 90,293 MW or 73.4% of what they accepted into the grid from IWT generation strongly suggesting it wasn’t needed. IESO sold that power at an average price of $16.83/MWh on the 22nd and $18.83/MWh on the 24th so we ratepayers wound up paying $512.21/MWh or 51.2 cents/kWh for the 32,735 MW that was apparently required in Ontario to keep the grid supplied with what was in demand. The total costs of the IWT generation coupled with the curtailment costs were $18,378,020 and we were paid $1,611,881 for the 90,293 MW they sold over the intertie lines resulting in the foregoing cost of $512.21/MWh for the 32,735 MW used in the Ontario grid and a net cost to ratepayers and taxpayers of $16,767,139!
The owners of the IWT were surely rubbing their hands in glee while Ontario taxpayers were forced to pick up $7.3 billion in costs associated with “Cost-Relief Programs” caused by the intermittent and unreliable supply of electricity from principally those IWT and to a lesser degree solar generation sources!
California
In California a recent article noted “In 2024, residential PV (Photovoltaic) will shift nearly $4 billion onto others’ bills, more than double the 2020 amount.“
What the foregoing statement implies is the plentiful solar panels sitting on residential roofs in California contribute much less towards the “fixed costs” which are detailed as: “vegetation management, grid hardening, distribution line undergrounding, EV charging stations, subsidies for low income customers, energy efficiency programs, and the poles and wires that we all rely on whether we are taking electricity off the grid or putting it onto the grid from our rooftop PV systems.“ The effect is a layering of those costs onto all the other ratepayers without rooftop solar.
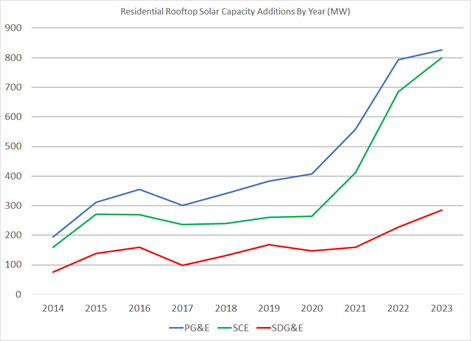
To put the foregoing into perspective the article goes on to state: “In 2014, the homes served by these three IOUs (Investor-owned utilities) got less than 2% of their electricity off their roofs. Today they get about 20%. As fewer kWhs are sold from the grid, retail rates must rise even more in order to recover the fixed costs of the system.“ The story goes on to note California’s electricity rates are more than double the national average in the U.S.
The following chart from the article shows the steep climb in rooftop solar in the state:
Another article related to California basically aligns with Ontario’s IWT issues due to lower demand during the Spring noting: “Solar energy waste is most prevalent in the spring when there is less need for heating and cooling. Use is high in the morning and evening but drastically reduces during the day. Therefore, the National Renewable Energy Laboratory found that with a high demand of solar power on an electricity grid, the netload of renewable energy takes on a “U” shape. However, even when demand is low, solar panels continue to absorb energy that goes to waste. In 2022, the state wasted 2.4 million megawatt-hours of electricity, and 95% of that was solar. Throwing away free power raises electricity prices.“
Conclusion
The foregoing actually presents proof that politicians in both California and Ontario who pushed the renewable energy agenda have been responsible for driving up what we all consider a basic necessity of life. They failed to see the future implications of the transition to “renewable energy” in an effort to reputedly save the world from “climate change”!
The time has come for politicians to appreciate their inability to predict the future and stick to managing our bureaucracies in a way that will ensure “energy security” without inflation driven concepts sold to them by the eco-warriors!
Should one scroll down to page 366 in the recently released Federal Budget under the highlighted “Total tax revenues” it announces as one source for the 2024-2025 year, they anticipate collecting $14.9 billion!They clearly state where that revenue is generated from and destined for in the future: “Pollution pricing proceeds to be returned to Canadians“!
It represents only 3.3% of the forecasted tax revenues yet it is still significant in that it is approximately $530.00 for each and every taxpayer but only about 50% of what they are granting to VW and Stellantis to manufacture EV!
So we 28 million taxpayers should wonder: Where are those recycled tax dollars coming from?
The Federal Carbon Charge
As it turns out it will be us taxpayers (residential and industrial) who are providing those “Pollution pricing proceeds” that supposedly will be returned to us, or will they?
Examining the Federal Government’s documents on the “Circular Economy” as it appears to apply, is summed up by them as follows:
“The federal carbon pollution pricing system has two parts: a regulatory charge on fossil fuels such as gasoline and natural gas, known as the fuel charge, and a performance‑based system for industries, known as the Output-Based Pricing System (OBPS). The federal system can apply in whole or in part in a jurisdiction.
Canada also designed its system to be revenue neutral: where the federal system is applied, all direct proceeds from the federal fuel charge and federal OBPS are returned to the province or territory where they were collected.“
Examining the Federal Carbon Charge (FCC) for Natural Gas
The government has decreed they are leveling a charge on natural gas, so it is worthwhile to note that according to the CGA (Canadian Gas Association) what Canada’s GHG emissions are from natural gas. The CGA states: “In 2020 the transmission, distribution and storage of natural gas produced around 10 Mt CO2eq emissions (Canada’s total GHG emissions were 672 Mt CO2eq) ie: 1.4% of emissions came from natural gas! We should wonder how those emissions if eliminated would be even noticeable as Canada’s total emissions on a global scale are only 1.5%.
The CGA also provide individual statistics and note in “2021the average residential natural gas customer used 2,385 cubic metres1 of natural gas. Annual residential gas use varies across Canada from 1,900 to 3,100 cubic metres per year, depending on the climate in the region.”
The FCC as of April 1st, 2024, increased to 15.3 cents per cubic metre so if the average consumption remains the same in the current year the natural gas bill to heat your household will include $364 of those FCC costs!
The CGA report the total number of households who heat their homes with natural gas in Canada was over 6.8 million in the 2021-2022 season. What the CGA basically state is; all households with natural gas to heat their homes annually consume 16,218 million cubic metres of that fossil fuel source. The Federal government on the other hand suggest natural gas can be replaced with either expensive heat pumps using electricity from a fossil free grid at less cost or fuel your electric furnace from those same electricity grids!
If one does the simple math by multiplying 15.3 cents per cubic metre of natural gas consumed by those 6.8 million households the revenue from that charge represents $2.47 billion or 16.6% of the $14.9 billion they estimate as tax revenue associated with the “Pollution pricing proceeds to be returned to Canadians”!
Industrial Gas Costs
The Federal Fuel Charge Rates also apply to natural gas used for industrial purposes and if combined with hydrogen it is considered “non-marketable natural gas”! The FCC has been set at an even higher rate of 20.6 cents per cubic metre for it, in the 2024-2025 year but no consumption disclosures are available for the latter.
Looking at the StatsCAN data from June 2023 it notes; “In December 2022, natural gas deliveries to industrial consumers in Canada totalled about 8.3 billion cubic metres, with over 70% going to Alberta. The industrial sector in Alberta—the single largest consumer of natural gas in the country—received a record 5.8 billion cubic metres in December, the majority of which was used as fuel by the energy producing sector.“
As neither StatsCan nor the CER disclose what the total “non-marketable natural gas” was we will use the above noted 15.3cents per cubic metre to calculate the foregoing. It suggests those 8.3 billion cubic metres would have generated revenue of $127 million for the month of December 2022 and perhaps as much as $1.5 billion for the full year 2024-2025 at those rates if those volumes are constant! The $1.5 billion would represent 10.1% of the forecasted $14.9 billion to the “Pollution pricing proceeds to be returned to Canadians”. Now try to imagine how that $1.5 billion in FCC costs would impact what those “industries” (including farmers, etc.) are producing by driving up their costs.
The foregoing suggests the combined FCC (Federal Carbon Costs) associated with Canada’s generation and consumption of natural gas would collectively represent about 26.7% or $3.975 billion of the $14.9 billion contained in the budget. This works out to around $141.00 per taxpayer so we should assume the shortfall in the budget projections will all come from the FCC applied to the use of other fossil fuels such as gasoline, diesel, propane, etc. fuels!
The price per metric ton of emissions from the natural gas sector for 2024-2025 looks to average around $39.75 per ton but its impact will drive up the price of everything associated with it and have only a very minor (immeasurable) impact on reducing Canada’s emissions!
Maybe PM Trudeau and NDP Leader Singh should get busy and plant some of those two billion trees he promised Greta Thunberg to absorb those GHG and save us Canadian households from this cost-of-living increase and avoid the “circular economy” designed by the WEF!