Dispelling the Cult Claim—”Wind and Solar are Lower Cost Generation than Natural Gas”

Intrigued by the many eco-warriors touting how wind and solar are cheaper generation sources then natural gas I decided to use Scott Luft’s (Cold Air) compilation of data for 2023 to calculate on a “simple” basis what each generation source actually cost us ratepayers/taxpayers to see if the claims made were even close to the truth.  Below is a small sampling of what the claims were and who made them! Please note that four of them are registered “charities” and one is from the  Federal Ministry of the Environment and Climate Change!

Environmental Defence

While natural gas prices have skyrocketed in the last year and will remain volatile, wind and solar are now the cheapest form of new electricity generation and offer lower rates for the consumer.“

Ontario Clean Air Alliance

Solar and wind power now cost a fraction of what power from gas-fired power plants or nuclear reactors costs. It is simply the lowest cost way to meet our growing electricity needs, and Ontario has tremendous solar and wind potential.”

David Suzuki Foundation

As we move to clean, renewable electricity, we also move to more affordable energy for households in Canada. This is in part because renewable electricity sources like wind and solar are now the cheapest forms of electricity in history.

Government of Canada: Alberta: Clean electricity snapshot

Renewable electricity projects such as solar and wind are cheaper than natural gas. Several studies are showing that in Canada a shift to net-zero electricity can support affordability and result in energy savings for households.“

Canadian Climate InstituteClean power is cheap. Wind can now produce electricity at lower costs than natural gas-fired power in Alberta and Ontario. Solar power is already cheaper than electricity from gas in Alberta and is on track to be 16 per cent less expensive by the end of the decade.“

The foregoing quote is from CCI, a charity, where Rick Smith (formerly with Environmental Defence) is the President earning somewhere between $250,000 and $299,999 annually. CCI was a creation of Catherine McKenna when she was Minister of the Environment and Climate Change and handed them $20 million of our tax dollars for a five-year study period.  CCI were recently (April 2023) handed another $30 million of our tax dollars by the Ministry of the Environment and Climate Change now headed up by Steven Guilbeault, even though the five-year period wasn’t finished!  

Now, let’s have a look at the Annual Average Cost by Generator Source in 2023 in Ontario using Cold Air’s compilation to determine if any of the foregoing quotes are anywhere close to the truth:

First let’s start with Cold Air’s post of IESO 2023 data by simply displaying his charts!

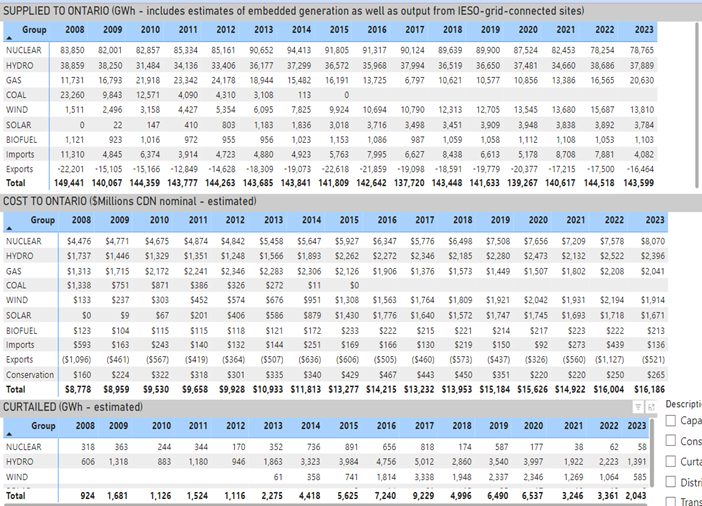
As is readily apparent from  the above the first compilation contains the power generated by each of the generation sources in Ontario by GWh (Gigawatt hour) and the second compilation contains the costs of each generation source.  That makes it relatively easy to calculate the average per kWh (kilowatt hour) cost for each source of power by simply dividing the costs by the GWh delivered.  What we find is the following:

2023 Cost by Generation Source in Ontario

Generation            GWh                       Cost Millions         Cost per kWh       

Nuclear                 78,765 GWh          $8,070.                  10.2 cents

Hydro                    37,889 GWh          $2,396.                    6.3 cents

Natural Gas         20,630 GWh          $2,041.                    9.9 cents

Wind                      13,810 GWh          $1,914.                  13.8 cents

Solar                       3,784 GWh           $1,671.                  44.1 cents

Biofuel                    1,103 GWh           $   213.                   19.3 cents

Conclusion:

The only generation source cheaper than natural gas generation in Ontario in 2023 was hydro whereas wind, solar and biofuel generation are much more expensive than hydro, natural gas or nuclear!

The time has come to defund the eco-warriors and tell them to do some basic math retraining.  The foregoing might allow them to get a real job that won’t harm our economic well being and at the same time will save us some taxes and perhaps even lower our inflation rate along with our annual Federal deficit!

Oh yes, it will also keep our costs of electricity at reasonable and competitive levels while providing the rampable power needed to avoid blackouts!

IWT Intermittency and Unreliable Nature is Creating Future Environmental Pollution with BESS Needs

Should one bother to review IESO’s hourly generation data for February 3rd, and the first seven hours of February 4th one would note the IWT (industrial wind turbines) delivered a grand total of 2,673 MW which means they operated at an average 1.8% of their rated capacity over those 31 hours! Amazingly for the first time in the last couple of weeks we finally saw the sun shining on February 3rd and solar generated 1,831 MW or 13.4% of its capacity!

During those same 31 hours Ontario natural gas plants generated 116,228 MW so the question becomes—what could have replaced what they generated if we assume the power consumed during those 31 hours was necessary to keep the lights on and our furnaces operating during cold winter days?

It would appear the eco-warrior charities such as Environmental Defence (ED) and the Ontario Clean Air Alliance (OCAA) have the answer!   Here is ED’s answer: “Ontario needs to phase out, not ramp up the use of fossil gas to generate electricity. And it’s possible if Ontario invests in clean solutions like solar and wind, along with battery storage which allows the energy to be used when needed.”

Not to be outdone the OCAA solution is quite similar: “We need to phase-out the now unnecessary use of gas for electricity generation and move to sustainable solutions, including enhanced energy efficiency efforts, waterpower imports from Quebec and a newly invigorated renewable energy industry in Ontario.“

Woops, it appears the OCAA fails to examine IESO data which for the 31 hours indicates Ontario net-exports to Quebec exceeded 45,000 MW or almost 30% of the natural gas energy generated. It sure appears that solution from the OCAA is “off the table” so we are down to expect solar, wind and battery storage as the answer to ridding ourselves of natural gas generation which can be ramped up and down as needed unlike solar and wind!

The foregoing revelation comes at a time when IESO has forecast Ontario’s electricity demand will double as Ontario’s current government believes and pushes for full “electrification” by 2050!

Now try, if you can, to imagine how much more wind and solar would be needed just to produce as much power as those natural gas plants did and visualize how much of Ontario’s landscape would be covered. Yes, it would be immense so is obviously not the solution leaving only BESS (battery energy storage systems) as the alternative. The trouble is BESS units only are capable of storing 4 hours of their rated capacity meaning to replace the 116,228 MW of natural gas would require over 29,000 MW of BESS units (116,228 divided by 4 hours).  To put that in perspective it would be about 110 times of just one of the existing BESS contracts that have been awarded but, are not yet up and running, which is the Oneida BESS unit.  It is believed other contracts have been awarded however, as reported in an article in Renewable Energy World!  To wit: “In mid-May, the IESO offered contracts to seven battery storage facilities located throughout the province, varying in size from 5 MW to 300 MW.“ 

There are no clear examples to point to as to the cost of BESS units with the only one with dollars mentioned was the one suggesting the cost for the 250 MW Oneida BESS unit and was referenced in a prior article. The estimated cost of the Oneida unit was in the neighbourhood of $800 million so 110 of that size would suggest a cost of almost $90 billion. That would undoubtedly lead to layering those costs on top of both baseload power (nuclear and hydro) and those intermittent and unreliable wind and solar costs without the possibilities and prevention of blackouts or brownouts caused by those dreary days without the wind blowing or any sunshine!

Now, should the Ford led Ontario Government proceed with the foregoing BESS acquisitions it would put the costs associated with the McGuinty/Wynne Green Energy Act debacle to shame!  Oh yes, and please tell us how those BESS units will be recycled when they reach their end-of-life!

Fingers crossed; the Ford government don’t allow the above to happen!

Some Sanity returns to the Ontario Ministry of Energy but Renewables May Reappear

On January 30, 2024, the Ontario Minister of Energy, Todd Smith, announced the planned refurbishment of the Pickering Nuclear Plant which was welcomed news by those of us in Ontario and around the world who have no faith in the abilities of wind, solar and storage to keep the lights on and the furnace humming during cold winter days and nights. While the refurbishment will not be completed for 11 years, we should assume that simply means the last of the four 500 MW units will be up and running by that date.  The 2,000 MW annually will supply about 17.5 TWh of clean non-emitting power or what 2 million average Ontario household use annually.

As an aside in 2023 Ontario’s natural gas generation produced 20.6 TWh or about what 2.3 million households annually consume.

Eco-Warriors are Upset

While most Ontarians welcomed the announcement by Minister Smith the Ontario Clean Air Alliance (OCAA), a charity, with Jack Gibbons at the helm, were screaming mad posting their views claiming wind, solar and storage (including claiming storing surplus in Quebec’s hydro reservoirs) is cheaper then nuclear and would save us from “global warming”!  Additionally, Gibbons and his small crew have somehow managed over the past couple of years; to convince 35 municipalities they should endorse a “gas power phase-out”! That suggests many municipal politicians have no concept on how the electricity sector actually works as Gibbons in his presentations to the councils never mentions the unreliable and intermittent nature of wind and solar generation! He also fails to notice Hydro Quebec’s contracts to export power to several US states meaning they have no surplus power availability in the winter months when their peak demand periods occur.  They frequently ask their households to reduce demand during their winter months as this link clearly states: Being energy wise in cold weather | Hydro-Québec (hydroquebec.com)

Repeal of the Green Energy Act gave Municipalities the power to accept or reject Renewable Energy

Most Ontarians were delighted when the Ford led Ontario Conservative Party were challenging the Wynne led Ontario Liberal Party in the election in 2018 and promised to repeal the GEA as they had seen electricity rates soar. The result of that election was the OLP wound up as the “minivan party”.  Shortly after they were elected the Ford led government repealed the GEA as they promised and killed a number of projects the Wynne led government had previously approved. The repeal of the GEA basically gave municipal governments the power to accept or reject renewable energy projects in the future but for some reason one industrial wind turbine project, Nation Rise, a 100 MW IWT project near the villages of Crysler and Berwick wasn’t cancelled. This was despite, in the runup to the election, saw Doug Ford shaking hands with Ruby Mekker, 68, a retired educator and one of the project’s most vocal opponents stating: “Doug Ford shook my hand. He said, ‘Turbines are done’.” 

Apparently, they weren’t “done” in Crysler and Berwick as the 100 MW Industrial Wind Farm is up and running and causing harm to birds, bats, humans and water aquifers!

IESO’s press release on December 11, 2023, stated “In an update to the Minister of Energy, the IESO is targeting 2,000 MW of new non-emitting electricity generation, including wind, solar, hydro and bioenergy. Subsequent procurements will target an additional 3,000 MW. The IESO is also looking at options to re-acquire, upgrade, or expand existing facilities.“  

Needless to say, IESO’s announcement has triggered those renewable energy companies to jump on board to seek local municipal approval and one of those recent ones occurred in East Zorra-Tavistock where two industrial wind farms are proposed by Prowind Renewables, a reputed international company. 

What is particularly amusing is how one of the local politicians, Warden, Marcus Ryan is all in favour of those industrial wind turbines but refers to them as “windmills”!  Warden Ryan goes on to say “There is a commitment to advancing environmental sustainability, specifically climate-change mitigation and adaptation. If Oxford County was asked, I suspect it would be pretty easy to give support in principle,”.  It does appear that despite Warden Ryan’s love of “windmills” there are couples planning on fighting as a local newspaper reported.

“Another person also contacted the Gazette and said they are organizing a group of residents opposed to the development. “What we do know is that there are a growing number of landowners and homesteads that do not support wind turbines in our community. The concerns are the use of good productive agricultural land, as well as safety and health concerns for resident families and livestock,” he explained!

What was interesting is that the same day one of the newspapers reported the Prowind push for the local council to approve the two industrial wind farms an article that caught this writer’s attention out of the UK in Energy News Beat stated “Wind turbine explodes after bursting into flames at quiet Welsh farm, showering broken parts to the ground“ with several nasty pictures

Conclusion:

Those of us living in rural Ontario should assume many of those companies dedicated to pushing the narrative to add more unreliable and intermittent wind and solar generation will be seeking local council’s blessing in their push to obtain those contracts proffered by those renewable energy companies.

Hopefully, those who will be most affected will push their local politicians to say NO!

PS: For the benefit of Warden Marcus Ryan of East Zora-Travistock, the following is a picture of a “windmill”!

Gerald Butts might not be happy

Ontario Power Generation is making some moves that may make Gerald Butts both happy and unhappy

[Photo: Delsan AIM Environmental Services]
Former McGuinty major domo and Trudeau chief of staff Gerald Butts posted a Tweet about the demolition of the Ontario Power Generation (OPG) Nanticoke coal power plant with this somewhat off the wall claim.

Gerald Butts @gmbutts Aug 23  When Dalton McGuinty was elected in 2003, everyone (including OPG) told him this couldn’t be done. Then he and @DwightDuncan did it. This is what progress on #climatechange looks like. The end of 7550MW of coal in Ontario.”

He was inspired apparently by David Hains of the Globe and Mail who Tweeted about the demolition that “This is quite something not just for the spectacular visuals, but also how it closes the book on what was once the largest coal plant in North America, and the largest single source of greenhouse gases.”

So, here are some facts, to put Nanticoke into perspective with renewables.

Nanticoke versus solar

The 4,000 MW Nanticoke coal plant was able to produce 21 million MWh annually,* had 600 employees and has now been replaced by a 44 MW solar array that might produce 58,000 MWh** annually. This would make Gerald Butts happy!

Nanticoke could have produced 364 times more power than the 44 MW of solar panels! The 44 MW of solar panels sit on 260 acres and produce power when the sun shines, whereas the Nanticoke coal plant could produce power when needed. If OPG’s objective was to replace the 4,000 MW with solar (generating at an average of 15 per cent of capacity) they would require 364 times more solar panels and almost 96,000 acres*** of land! (One wonders if OPG had made that move how many employees would be required to sweep the snow off the panels come a blustery winter?)

Replacing Nanticoke’s potential generation with solar panels would have cost about $9.4 billion**** annually versus approximately $630 million at a cost of 3 cents/kwh.

Nanticoke vs. wind power   

Another OPG announcement in late May indicated they would abandon their one  industrial wind turbine (IWT)  and dismantle it.  The press release suggested: “At full power, it could produce enough energy to power about 330 homes.” What that implies is, the 1.8 MW turbine (located on the Pickering Nuclear plant site) operated at about 19% of its capacity to produce intermittent power for those homes. Had OPG opted to replace the Nanticoke coal plant with IWT generation operating at 30% of capacity they would have required 8,000 MW. As a matter of interest CanWEA reported 5,076 MW in operation in Ontario at the end of 2018. Those 8,000 MW of IWT may have supplied the 21 million MWh the Nanticoke plant was capable of generating but, only 35 per cent of the time when Ontario demand required it! The land needed for the 8,000 MW would be about 6,000 acres or twenty-three times the land Nanticoke used.

The annual cost of replacing Nanticoke’s generation with IWT would be north of $2.8 billion***** versus $630 million.

OPG back into fossil fuels

A very recent OPG announcement will surely make Gerald Butts very unhappy! An OPG subsidiary reached agreement with affiliates of TC Energy to acquire natural gas assets at a cost of $2.87 billion.  They are acquiring full ownership of the Napanee plant (900 MW) involved in the McGuinty/Liberal gas plant scandal, Halton Hills (683 MW) and the 50% (275 MW) of Portlands they don’t own.  In total, the 1,858 MW they are acquiring will cost $1.54 million/MW which appears on the high side; however, one would assume OPG would also retain the contracts.

In the case of the Napanee plant they will receive $15K per turbine per month for simply idling, meaning annual revenue should be $162 million.  It one assumes the remaining 958 MW will be paid at a lesser rate of say, $12K per turbine per month, that would add another $138 million annually.  In simple terms OPG should recover their full costs in just under 10 years!  What that hopefully means is the effect of the acquisition should be negligible in respect to ratepayers; however, it appears the Napanee plant has not been commissioned.  Ratepayers should hope the OPG agreement to purchase requires commissioning!


So, in summary, OPG is getting back into the fossil fuel business instead of adding renewable energy in the form of either solar panels or wind turbines. We ratepayers/taxpayers should remember the reason we needed the gas plants in the first place was to back up the intermittent and unreliable wind and solar plants that collectively represent about 7,500 MW of sporadic capacity and were instrumental in driving up electricity costs by a factor in excess of three times inflation rates.

PARKER GALLANT

*Enough to supply 2.5 million average Ontario households.

**Enough to supply 6,400 average households.

***That is almost equal to the area the City of London, Ontario currently occupies.

****At the current average cost of solar generation estimated as $$440 per MWh not including back-up

*****Estimated at a cost of $135 per MWh but without back-up.

OPG: generating less power, but earning more

Lots more. A record, in fact.

K2 Wind: first-to-the-grid rights for wind and solar, and lucrative 20-year contracts added to costs

Ontario Power Generation (OPG) released its 3rd Quarter report in mid-November, and it was impressive!

Revenue was up $156 million to $1,373 million (+12.8%) and after-tax income was 113% higher, increasing from $131 million to $279 million. For the first nine months of 2018, OPG reports RoE (return on equity) of 10.8% and will easily generate record after-tax profits for the full year of well over $1 billion. Nine-month profits sit at $948 million, up 84% or $433 million—that’s a record.

Revenue is also poised to crack the $5 billion-dollar level (nine-month revenue is $4,062 million) as it has many times in the past; however, after-tax profits have never been this high since the creation of OPG in 1999 when Ontario Hydro was broken up into several different entities.

What’s interesting about those record profits? OPG is record profits despite a substantial decline in generation.

Look at year-end December 31 2000: OPG generated and sold (into the grid) 139.8 TWh (terawatt hours) and earned revenue of $5,978 million for an after-tax profit of $605 million.   What that means is, back in 2000, OPG’s approximate cost to generate 1 TWh was $42.7 million (4.3 cents/kWh). In 2018 (so far) the cost has jumped to $74.8 million (7.5 cents/kWh) for the 54.3 TWh delivered in the first 9 months.

The 54.3 TWh delivered so far in 2018 is down from the comparable 2017 period by 1.7 TWh or 3% and from 2000 (9 months) by 49.4 TWh* or 46%!   Comparing the first nine months of 2018 to 2000, net income is up $405 million or 74.6%

With such significant drops in generation one would expect net income to drop so what happened?

Some five years ago (December 4, 2013) an article I wrote for Energy Probe was headed up: “OPG-whipping boy for the Ministry of Energy” and it outlined how the GEA (Green Energy Act) had a detrimental effect on OPG’s electricity generation and its revenue, which resulted in declining profits.

I noted how their many “unregulated hydro” assets received only the HOEP (hourly Ontario energy prices) which produced revenue of just over 2 cents/kWh, and how they had been instructed to build “Big Becky” (cost of $1.5 billion) and the Mattagami run-of-river project (cost of $2.6 billion).  Falling out of the GEA also was the rise in prices caused by wind and solar generation with first-to-the-grid rights and had resulted in declines in consumption. That meant much of OPG’s power generation was called on less and less.

OPG were also instructed by the Liberal Minister of Energy to convert power plants such as Atikokan and Thunder Bay from coal to biomass and to close the remaining coal-fired plants, one of which required a multi-million dollar write-down for prior expenditures on “scrubbers” to eliminate emissions.

As all this was happening, over the subsequent years, OPG applied for rate increases such as being paid “regulated prices” for all of their hydro assets and for revenue when they were forced to spill hydro. Those were eventually approved along with other increases to cover pension contribution shortfalls, increases in operational management and administrative costs (OMA), and for refurbishment of some nuclear plants.

OPG’s capacity has fallen from 25,800 MW in 2000** to 16,218 MW today, yet in 2000 they generated electricity at a capacity level of almost 62%. So far in 2018, they are operating at a capacity level of just under 51%.

OPG power could have eliminated excessive costs for wind and solar

If OPG were granted the rights to operate at the 62% level of capacity as they did in 2000, they could have generated 65.8 TWh easily, replacing all the generation produced by industrial wind turbines and solar panels. That generation would have resulted in a cost of electricity of less than 7.5 cents/kWh and eliminated the excessive costs for wind and solar under those 20-year contracts!

Today, OPG seems to no longer look like the “whipping boy” but still produces power at prices well below the costs of contracted generation under the GEA and should earn over $1 billion for 2018!

PARKER GALLANT

*Enough to power all of Ontario’s 4.9 million households for a full year with over 5 TWh left over.         **Staffing levels have dropped from 12,250 (including 650 under contract) in 2000 to 7,700 in 2018 meaning the ratio of employees to capacity has remained static at 2.1 employees per MW.

How Kathleen Wynne could have avoided public outcry over electricity costs

Former energy minister Thibeault and former premier Kathleen Wynne: no opinions wanted, thank you

Or, how she might have benefitted from listening to opinions (and saved Ontario millions)…

The following tweet from TVO reporter John Michael McGrath reflects the attitude of former Premier Kathleen Wynne to a question she was asked about an estimate of energy costs from yours truly:

 “John Michael McGrath‏ @jm_mcgrath                                                                                                           Tories introduce an estimate of energy costs from Parker Gallant, Wynne declines to comment on “one person’s opinion, one person’s research.”      10:20 AM – 3 Dec 2018”

The Select Committee on Financial Transparency questioning Wynne is/was attempting to determine the actual reason (e.g., hide debt and push the current cost of energy generation into the future) behind the creation of the Fair Hydro Plan (FHP) by the former Ontario Premier and her Cabinet.

Ontario is now one and a half years into the FHP which provides an opportunity to review the estimated costs of the 10 years of deferral by the Financial Accountability Office (FAO) of Ontario and see what has actually happened so far.

The FAO’s forecast estimated the deferral would cost $18.4 billion over 10 years plus another $21 billion for interest. The average monthly deferral (before interest costs) would therefore average $153 million.  Since the FHP first kicked in, IESO has posted monthly, what they call; the “Global Adjustment Modifier” (GAM) so, it is a relatively simple task to determine how the FAO’s estimates have played out, versus actual deferrals.

So far GAM deferrals (without interest costs) are $3,843 million for the 18 months — that’s about $770 per ratepayer. What that indicates is, the monthly average, so far, has been $214 million for the 17% of the GAM deferral versus the estimated $153 million in the FA0 forecast.  Should those averages continue for the next 10 years the deferred amount will be $25.7 billion or $5,140 per Class B ratepayer without interest costs. The additional $7.3 billion of the GAM deferral would also drive up interest costs to approximately $29 billion adding another $5,800 per ratepayer that would need to be repaid.

What that means is, future ratepayers could be on the hook for as much as $54.7 billion!

How could that $54.7 billion transfer to future ratepayers have been avoided?

The numbers are up in IESO’s website reflecting how much grid-connected wind power generation has been delivered for the first 9 months of the current year. My friend Scott Luft has provided the estimate of curtailed wind: the collective 8.98 TWh (terawatt hours)** translate to costs of $1,190.7 million. If one extrapolates the first nine months to a full year, the estimate of costs are $1,587.6 million for wind power.  IESO does not publish solar output (except for grid-connected) as most of solar is embedded within the distribution system.  Despite the lack of data, one can assume solar will have generated 15% of its capacity (380MW are grid-connected [TX] and 2,081 are distribution connected [DX]) meaning the 2,461 MW of capacity should generate approximately 3.23 TWh annually at an average cost of $448/MWh. That adds about $1,450 million to renewable’s costs.  Wind and solar together will therefore add $3.038 billion (rounded) annually to electricity costs assuming their capacity levels and annual generation remain at current levels.

As you can see, the estimated cost of wind and solar at $3.038 billion exceeds the adjusted annual GAM costs of $2.562 billion (18-month costs of $3,843 million/18 months X 12 months = $2,562 million) by $476 million.   At the same time TX- and DX-accepted wind (7.52 TWh) and solar (3.23 TWh) is assumed to come in at 10.75 TWh which presumably would need replacement.  In that regard the Ontario Power Generation 2018 3rd Quarter report indicates they spilled 2.4 TWh in the first nine months, which will probably transition to 3.2 TWh for the full year (ratepayers pay for spilled hydro so no additional costs) leaving a shortfall of just 7.55 TWh to be supplied to replace ALL wind and solar generation!

Without knowing, at this point, if nuclear generation had been steamed-off or exports could have been reduced, the question becomes: could gas plants*** have provided the 7.55 TWh (net after allowing for spilled hydro) wind and solar will probably provide for 2018?

Gas plants for the first nine months of 2018 generated 7.89 TWh; If extrapolated to 12 months, gas could generate 9.22 TWh and represent about 12.4% of its total capacity (8,500 MW). Adding another 7.55 TWh of generation would mean they would be required to operate at 22.5% of capacity so they could have easily replaced wind and solar generation.   The additional costs of that generation would be fuel costs plus a small mark-up.  Even if fuel costs and the mark-up were as much as $50/MWh the costs of the 7.55 TWh would amount to slightly less than $400 million.

What the foregoing suggests is that with no wind and solar generation, the costs of generation could have been reduced by $2,638 million (wind and solar costs of $3.038 billion less $400 million for additional gas generation of 7.55 TWh).

Coincidentally, the cost reduction of $2.638 billion per annum is remarkably close to the above noted GAM costs of $2.562 billion that will accumulate in the OPG Trust every year for the next 10 years along with the interest on that debt.

So, without wind and solar, former Premier Wynne might have avoided the public outcry about electricity costs and her party might have been re-elected.

Just “one person’s opinion, one person’s research”!

PARKER GALLANT

*Based on 5 million ratepaying households and Class B business consumers.                                                                   **Grid accepted: 7.52 TWh plus curtailed of 1.46 TWh = 8.98 TWh at a cost of $135/MWh for grid accepted and $120/MWh for curtailed.                                                                                                                             ***Gas plants are paid to idle at a rate as low as $4,200/MW per month (Lennox) to over $15,000/MW per month.


Calculating the costs of Ontario’s electricity: which sources add the most to our bills?

More transparency in the Ontario Energy Ministry  would reveal important facts, sooner 

The Ontario Energy Board (OEB) took more than nine months to compile and release what they label Ontario’s System-Wide Electricity Supply Mix: 2017 Data, a one-page document identifying the Electricity sources and the “Electricity Mix.”  The data includes both TX (transmission-delivered electricity) and DX (distributor-delivered electricity), but only in percentage terms. In order to determine the amount of electricity actually generated by the “Supply Mix” one must go through a mathematical exercise.

Lagging transparency

If one wonders why it takes nine months and why the OEB won’t supply the amount of electricity delivered by each of the “Electricity sources” you wouldn’t be alone.  Why have we spent billions on “smart meters” and the “smart grid” (developed by IESO) and the data can’t be provided within, say, the first Quarter of the following year?  That question should be raised by our elected politicians as the ratepayers of the province would like to know that all those billions weren’t wasted.

Digging deeper

Going though the math exercise isn’t unduly onerous; if one uses nuclear as the base (generating 60.1%) and the IESO “2017 Electricity Data” the information shows nuclear generated and delivered 90.6 TWh (terawatt hours), so the other percentages can be used to calculate the actual electricity delivered.  As all of nuclear generation is grid-connected, the total electricity generated (DX + TX) for 2017 was 150.7 TWh.  From that it is easy to determine solar with 2.2% generated 3.3 TWh, wind 10.85 TWh, hydro 38.6 TWh, biomass .6 TWh, natural gas 6.0 TWh and other .45 TWh. Add those figures to nuclear generation of 90.6 TWh and it comes to 150.7 TWh

The next step is determining the costs of those generation sources so we ratepayers can judge if they are giving us value for money. That is easier said than done; however, there are enough clues and information available to give us some reason to believe we will come close to disclosing costs.

Let’s start with the HOEP average for 2017 which was $15.81/MWh (megawatt hour) or $15.81 million per TWh meaning the 150.7 TWh of generation represents a cost of $2,282.6 million. The GA (Global Adjustment) inclusive of Class A and B for 2017 total was $11,851 million making total generation costs $14.233 billion for the 150.7 TWh.   Other costs such as transmission and wholesale market service charges add another $1.8 billion to total costs.  Adding the latter brings total cost to $16.033 billion.

If one than examines total Ontario demand for 2017, it would be the 132.1 TWh that IESO claim in their year-end report plus generation within the DX sector of 4.45 TWh making Ontario demand 136.55 TWh.

Finally, If one estimates the revenue generated from “net exports,”* reported as 12.471 TWh at the HOEP value of $15.81 million per TWh, the net revenue generated was $197 million reducing total electricity costs to $15.826 billion.

Putting total Ontario demand (136.55 TWh) in context, nuclear generation of 90.6 TWH and hydro’s 38.6 TWh together provided 94.6% (129.2 TWh). In 2017 OPG was forced to spill 6 TWh and Bruce Nuclear steamed off 1 TWh meaning those two generation sources could have supplied almost 100% (99.7%) of Ontario’s total demand.  Gas generation (10,548 MW capacity) could have easily supplied the balance including peak periods as they operated at only 6.5% of capacity.

So, what did wind and solar cost? 

Wind generated 10.85 TWh so at $135/MWh cost $1.465.000,000 + curtailment of 3.3 TWh at $120/MWh, added $396 million, making the total cost from wind generation $1,861,000,000. Solar generated 3.3 TWh so at an average of $448/MWh would add costs of $1,478,400,000

The two together — without including spilled hydro or steamed-off nuclear or gas back-up — totalled $3.339 billion.

The math calculation to get the actual cost of 2017 Ontario consumption therefore is simply dividing total electricity costs of $15.826 billion by 136.55 TWh, giving a per kWh cost of 11.6 cents kWh!

Without the total costs of wind and solar of $3.339 billion the costs of electricity consumed by Ontario electricity customers would have been $12.487 billion or 9.14 cents a kWh. That would have been 2.5 cents a kWh less than we experienced with wind and solar as generation sources.

The additional costs of wind and solar in 2017 added approximately $220.00 per average household to their electricity bills. Should wind and solar contribute similarly over the next 20 years the costs to Ontario ratepayers will be in excess of $66 billion.

The time has come to demand more transparency and to re-evaluate the details in long-term wind and solar contracts.

PARKER GALLANT

PS: Scott Luft has created pie charts that highlight much of what is contained in the foregoing article and they can be found here: https://twitter.com/ScottLuft/status/1050045294287745024/photo/1?ref_src=twsrc%5Etfw%7Ctwcamp%5Eembeddedtimeline%7Ctwterm%5Eprofile%3AScottLuft&ref_url=http%3A%2F%2Fcoldair.luftonline.net%2F

*exports less imports


Numbers don’t lie: intermittent wind and solar surplus to Ontario’s energy needs

The IESO (Independent Electricity System Operator) released 2017 data for grid-connected* generation and consumption and, surprise! The data reveal that power from wind and solar is surplus to Ontario’s  energy needs.

IESO reported Ontario’s consumption/demand fell 4.9 TWh (terawatt hours) in 2017 to 132.1 TWh. That’s a drop equivalent to 3.6% from the prior year.

Nuclear (90.6 TWh) and hydro (37.7 TWh) power generation was 128.3 TWh, making up 97.1% of Ontario’s total demand (without including dispatched power from either nuclear or hydro). The cost to Ontario ratepayers for the 128.3 TWh was approximately $7.6 billion or 5.9 cents/kWh.

Spilled hydro (paid for by Ontario’s ratepayers but not used) reported by Ontario Power Generation or OPG was 4.5 TWh for the first nine months of 2017. Out that together with 511 nuclear manoeuvres and the number is 959.2 GWh (gigawatt hours) wasted but paid for by Ontario’s ratepayers. Add in three nuclear shutdowns and it means Ontario’s nuclear and hydro generation alone could have easily supplied more than 136 TWh of power or over 103% of demand.

That doesn’t include spilled hydro in the last quarter of 2017 which will probably exceed at least one TWh.

Nuclear and hydro does it all

Nuclear and hydro could also have supplied a large portion of net exports (exports less imports) had all the generation potential actually been delivered to the grid. Net exports totaled 12.5 TWh in 2017.  Grid connected wind (9.2 TWh) and solar (0.5 TWh) in 2017 supplied 9.7 TWh and their back-up generation: from gas plants, supplied 5.9 TWh.  In all, the latter three sources delivered 15.6 TWh or 124.8% of net exports.  Net exports were sold well below the average cost of generation. Exports brought in revenue of about $400 million, but here’s the kicker: that surplus power cost Ontario’s ratepayers $1.4 billion, which is really a loss of $1 billion.

Grid-connected wind, solar and gas generation collectively cost approximately $3.5 billion for the 15.6 TWh they delivered to the grid, included curtailed (paid for but not used) wind power generation of 3.3 TWh. The cost of the wind power was more than $220 million per TWh, or 22 cents/kWh. That’s almost double the Class B average rate of 11.55 cents/kWh cited in IESO’s 2017 year-end results.

The 9.7 TWh generated by wind and solar was unneeded. If it had been required, it could have been replaced by gas power generation at a cost of only around two cents per kWh. Why? Gas generators are guaranteed payment of  about $10K per MW (average) of their capacity per month to be at the ready and if called on to generate power are paid fuel costs plus a small markup.

Price tag: $2 billion

In other words, if no grid-connected wind or solar generation existed in Ontario in 2017 the bill to ratepayers would have been about $2 billion** less! Grid-connected wind generation (including curtailed) cost ratepayers in excess of $1.7 billion and grid-connected solar added another $250 million!

That $2 billion, coincidentally, is about the same cost estimate of the annual amount to be deferred, and paid by future rate increases via the Fair Hydro Plan! In other words the current government could have easily saved future generations the estimated $40 billion plus cost of the Fair Hydro Plan by having never contracted for wind and solar generation!

The IESO results for 2017 sure makes me wonder: why hasn’t the Ontario Ministry of Energy canceled all the wind power projects that have not yet broken ground?


*   Distributor connected solar (2,200 MW) and wind (600 MW) added over $1.4 billion to the GA.

** The first 6 months of the variance account under the Fair Hydro Plan in 2017 was $1,378.4 million.


Ontario’s energy poverty: how we got here and why government plans won’t work


Former Energy Minister Chiarelli told us not to worry about costs — now hundreds of thousands live in ‘energy poverty’

An OEB report dated December 22, 2014, completed at the request of the then Minister of Energy Bob Chiarelli opened with this remark: “The Minister asked the Board to provide advice on the development of an Ontario Electricity Support Program (OESP), which would assist low-income customers who are spending a disproportionate amount of their income paying for electricity.”

The report used various methods to determine the potential number of households in the province in that category and concluded: “Using LIM (Low Income Measure) as a measuring tool, and relying on Statistics Canada household data, Ontario has 713,300 low-income households. The OESP is estimated to reach 571,000. This estimate recognizes that not all low-income households in the province pay their electricity bills directly (i.e. utilities included in rent).”

It went on further to state: “Using LICO, (Low-Income Cut-Off) Ontario has 606,100 low-income households, and the OESP would reach only 484,900. Using LICO plus 15 per cent, the current LEAP (Low-income Energy Assistance Program) measure of low-income, the number of households would be 687,300 and 550,000, respectively.” 

What that suggests is that, at the time of the OEB report the StatsCan data in 2014, using LICO, indicates approximately 13,5% of households were “spending a disproportionate amount of their income paying for electricity”. Using LIM, the number jumps to 15.8%! Rate increases from November 2014 to November 2016; according to the OEB, were 1.6 cents/kWh (+17%) for an average residential household, so we would expect more households were thrown into “energy poverty”!*

So what did the Ontario government do to alleviate the problem?

The LEAP (Low-income Energy Assistance Program) kicked off in 2010 requiring all local distribution companies (LDC) to contribute 0.12% of distribution revenue (net of the cost of power).  The total amount allocated for this program is less than $5 million annually.

The RRRP (Rural and Remote Rate Protection) has been around since 2003 and provided relief to some rural and remote residential ratepayers.  The annual cost of $170 million was paid by other ratepayers and was recently (January 2017) expanded by the current government to cover more Hydro One customers increasing the annual cost to an estimated $243 million now paid from tax revenues.

The OESP (Ontario Electricity Support Program) as noted above was triggered by a directive from Bob Chiarelli when he was the Minister of Energy and was estimated to cost between $175/225 million to support those hundreds of thousands of households living in energy poverty.  The program was initiated in January 2016 and paid for by all Ontario ratepayers via the regulatory charge on hydro bills. The program has been expanded to provide more support to low-income households and the costs are now paid out of tax revenues.  The projected cost increased to approximately $300 million per annum!

The First Nations On-Reserve Delivery Credit is a new incentive providing approximately 21,500 customers with free delivery charges (estimated at $85.00 per month) at an annual cost of $21 million.

The Affordability Fund is also a new program funded by taxpayers to provide qualifying households with: LED lights, appliance upgrades, insulation, heat pumps, etc., all for free at the taxpayers’ expense, estimated at $100 million.  It’s not clear if this is to be an annual or a one-time fund!

All of the above initiatives, with the exception of the LEAP program, are now funded by taxpayers, so about $370 million was transferred from ratepayers to taxpayers and annual funding costs increased to approximately $660 million!

That’s on top of the $40 billion deferred under the Fair Hydro Plan!

How was so much energy poverty caused?

The quick answer to the above question is, it was caused by the Green Energy Act (GEA) which gave long-term contracts to mainly foreign industrial wind and solar developers. Wind and solar provide unreliable and intermittent generation and must be backed-up by gas plants doubling up on the costs.  The results have been evident since those power sources were added to our grid in larger and larger quantities.   The following highlight some of the estimated costs for the first nine months of 2017:

  • Nine months of curtailed (could have been generated but wasn’t needed) wind of 2,209,000 MWh (megawatt hours) were paid $120/MWh so cost ratepayers $265 million.
  • Nine months of spilled (over the dam but not through the turbines) hydro power of 4,500,000 MWh by OPG cost ratepayers almost $185 million.
  • Nine months of subsidized surplus power of net exports (exports minus imports) of slightly over 9 million MWh to our neighbours cost ratepayers about $800 million.
  • Nine months of “conservation” spending is estimated to have cost Ontario ratepayers $300 million.

Totalling up the above, and forgetting about the costs of steamed-off nuclear or money paid for idling gas plants to back-up wind and solar, gets this result: Ontario’s electricity system paid for 15.7 million MWh that provided no power for Ontario’s ratepayers.

That 15.7 million MWh could have supplied over 1.7 million average Ontario households with power for a full year, but instead added their costs to our electricity system.   Those costs of an estimated $1.550 billion were 2.3 times the relief provided to households living in energy poverty!

To conclude, what created more “energy poverty” in the province is to simply point to bad planning (no cost/benefit analysis) by the incumbent government. Their plan to resolve it? I will simply repeat former Minister of Energy Bob Chiarelli’s promise, “it’s just the price of a Timmies cup of coffee”—every day of the year for many, many years!


* Energy poverty is generally defined as 10% or more of disposable income is spent on heat and hydro!

Wynne spin and the “Fair Hydro Plan”

Re-reading Premier Wynne’s statement of March 2, 2017 on her announcement of Ontario’s Fair Hydro Plan, one is struck by the avoidance of the truth, the sudden empathy displayed and her blatant claims.   As one example, she suddenly noticed “Electricity is not a frill — it’s an essential part of our daily lives.”

The Premier has obviously forgotten her party clearly treated it as a “frill” by taking advice from environmentalists who persuaded her (and predecessor Dalton McGuinty) that industrial wind turbines (IWT) and solar panels could easily replace the power generated by coal plants.  They were so taken by those claims the energy minister didn’t bother to do a cost-benefit analysis as noted by Ontario’s Auditor General (AG).  They also charged ahead installing “smart meters” at a cost of $2 billion (AG report) and instructed the OPA (Ontario Power Authority) to acquire 10,500 MW of renewable energy principally in the form of IWT and solar panels.

The year prior (2008) to the creation of the Green Energy Act, Ontario’s coal generation plants produced 23.2 TWh (terawatts) or enough electricity to supply 2.4 million (55%) average households .  In 2016 wind and solar* collectively and intermittently generated 14.2 TWh — 9 TWh less than coal plants generated in 2008.   The collective cost of wind and solar and their back-up (gas) in 2016 was approximately $3.8 billion or 27 cents per kilowatt (kWh,) whereas the cost per kWh of coal power generated in 2008 was 5.5 cents/kWh (OPG annual report).

Renewables: five times more costly

In short, the collective cost of electricity supplied by renewables and their back-up (gas) to replace coal generation turned out to be five times more which clearly raised the cost of the “frill,” but our Premier(s) and Energy Ministers were apparently unaware** costs were rising to that extent.

On the latter point the Premier in her statement claims: “But it’s not as if I’ve been unaware of the challenge. I have seen the rising rates. My family and I get a bill like anyone else.”  Premier Wynne’s salary in 2016 was $208,974.00 and in 2006 was $108,031.00 so she has seen a pay increase of 92% in 10 years.  It’s doubtful she was impacted by the $536,84 average annual increase she experienced in her cost of electricity as it represents less than one day’s pay at her current compensation level.

The Premier’s statement blames rate increases on past governments and claims since the Liberals regained power in 2003 they had to engage in “fixing a system that had been structured unwisely”.  Naturally, the 2003 blackout (caused by a fault in Northern Ohio) is blamed for the upgrade by the Premier to obscure their contracting of unreliable and intermittent wind and solar generation at above market prices.  The Premier now claims the “electricity grid” they created “is second to none.” And yet, the AG noted in  her December 2015 annual report that power outages increased 24% and lasted 30% longer!

Later in her statement the Premier notes “But the way we financed those investments was a mistake.”  The disturbing part of the statement about “those investments”, was Premier Wynne’s assertion “In the past few years we’ve invested more than $50 billion in electricity infrastructure — new dams in the south, new towers in the north, $13 billion to refurbish nuclear power plants alone and billions more to ensure new transmission and distribution lines everywhere.”

That part of the Premier’s spin will form the basis of Part 2, in this series, tomorrow.


* Wind and solar generation are classified as “base-load” generation whereas coal was strictly used for “peaking” (high demand periods) purposes.

** The writer has consistently sent Premier Wynne and her predecessor along with the various Energy Ministers a link to every article written no matter where it appeared.